Controller Operation
Once installed and configured, each Controller serves a few different roles:
As an administrative interface into your Bowtie networking plane for actions such as device approval/rejection and policies.
As a network router that couples together all connected clients.
Use this part of the documentation to aid in actively administering and using the Controller. If you’re simply using a Bowtie Client that relies on a Controller for connectivity, you likely do not need to work directly with a Controller appliance as outlined in the following sections.
The first section (Control Plane Interface) provides a walk-through for the web application meant for use by network operators when administering a Bowtie installation. The second section (Controller Maintenance) outlines the tools available for deeper introspection into the Controller’s operating environment, such as host-level resource use and performance.
For additional information regarding using the Controller from the perspective of a login shell for tasks like package management or command-line work, consult the knowledge base article.
Control Plane Terraform configuration
Many resources that you’ll find in the Control Plane Interface may be configured over the web interface or with automation using the Bowtie Terraform Provider if you prefer to control these settings with infrastructure-as-code.
Some Controller metadata may be found using the meta control plane API.
Control Plane Interface
Browsing to a given Controller’s web endpoint presents the Control Plane page. Each link on the sidebar provides access to the key functions for Controllers:
Control Plane
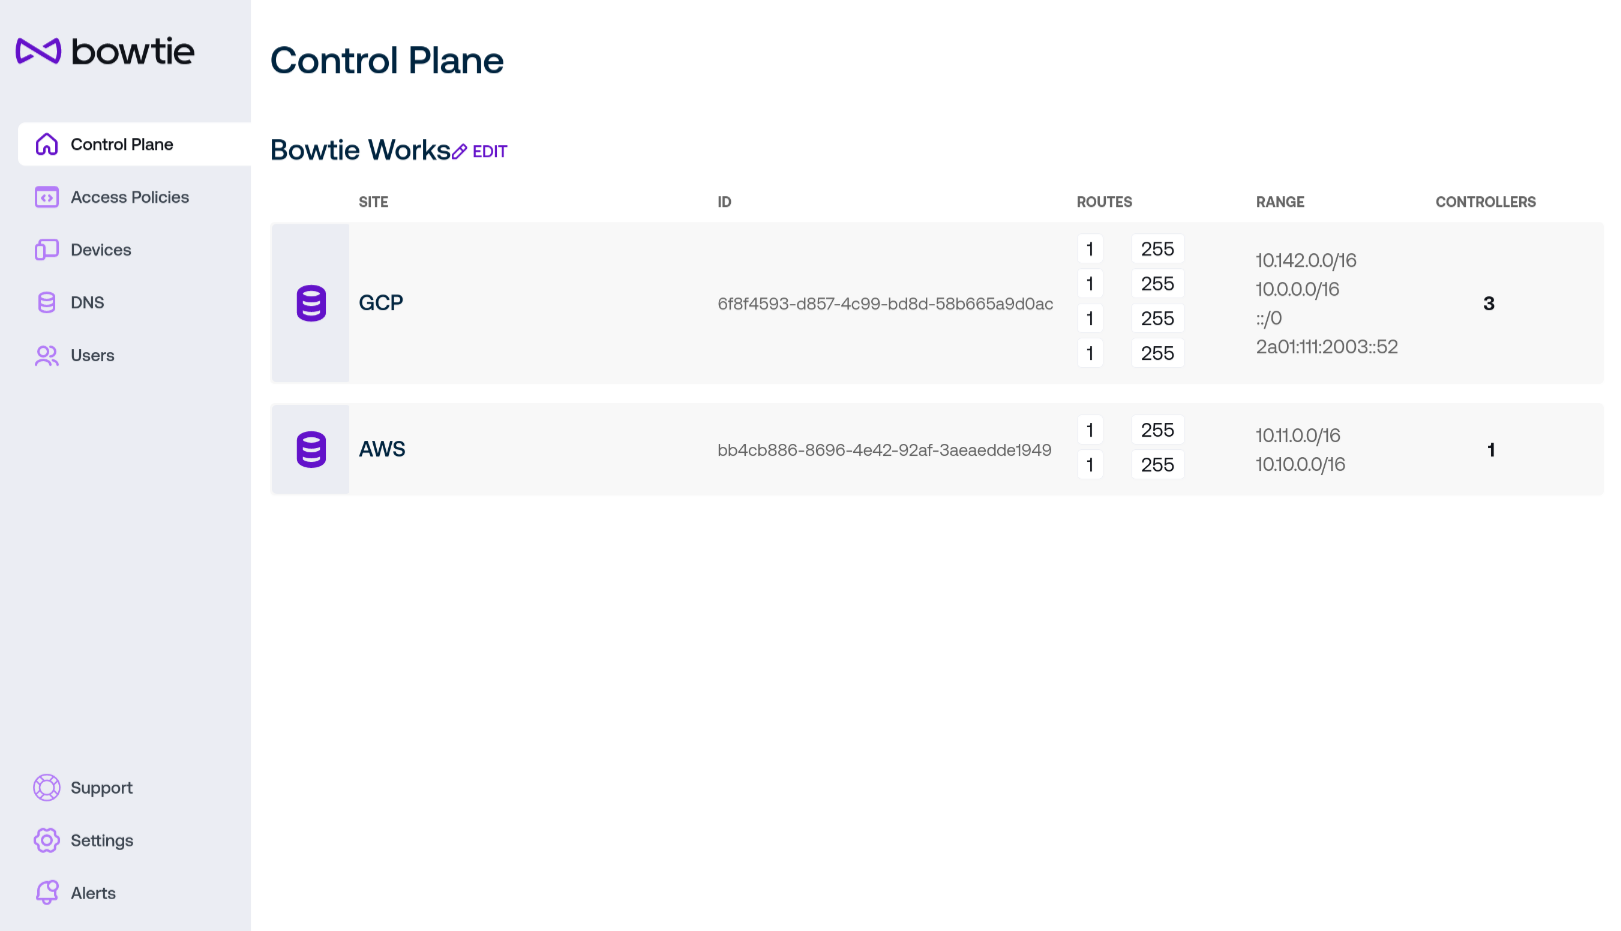
This landing page presents you with the list of all Sites known to the Controller. On this page you can easily view the related Controller subnets and hostnames.
From the control plane page, appropriately-authorized users may change the human-readable organization Name by clicking on its Edit button at the top of the page.
Click on the row for a site to view addition details about its configuration and associated Controllers:
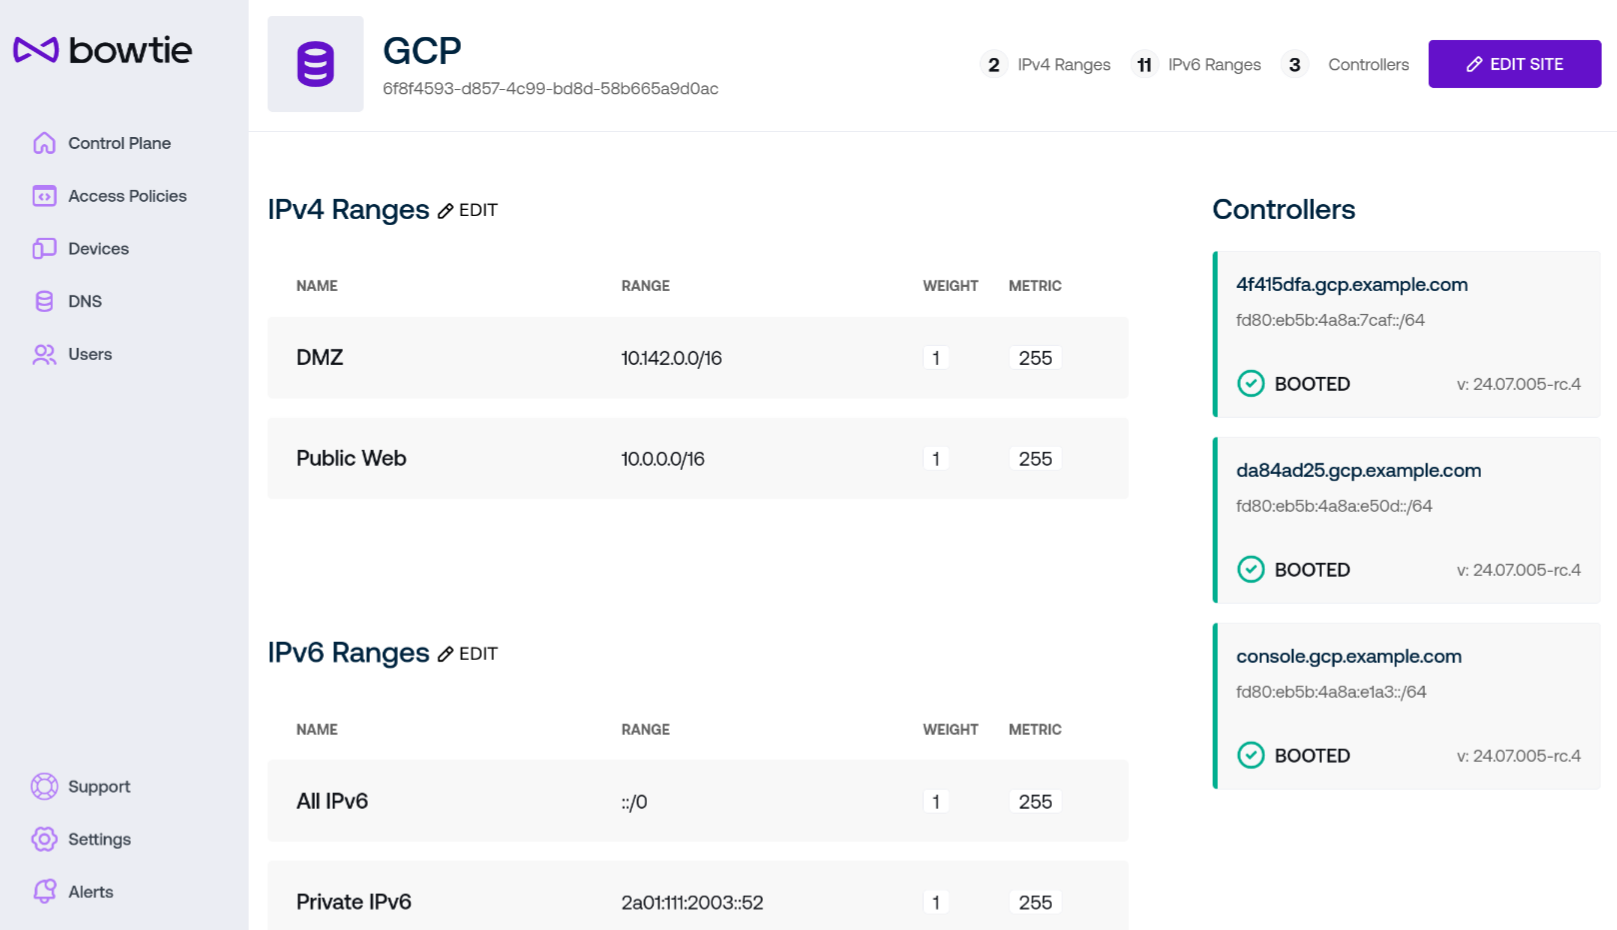
Each site has site ranges that may be edited from this page to change the network served by each site and its set of controllers. The cards on the right of the page represent individual Controllers that host Controller Settings pages.
To begin editing a site, click on the Edit Site button on the upper right of the page to enter editing mode.
Configurable fields will change from their read-only forms for editing.
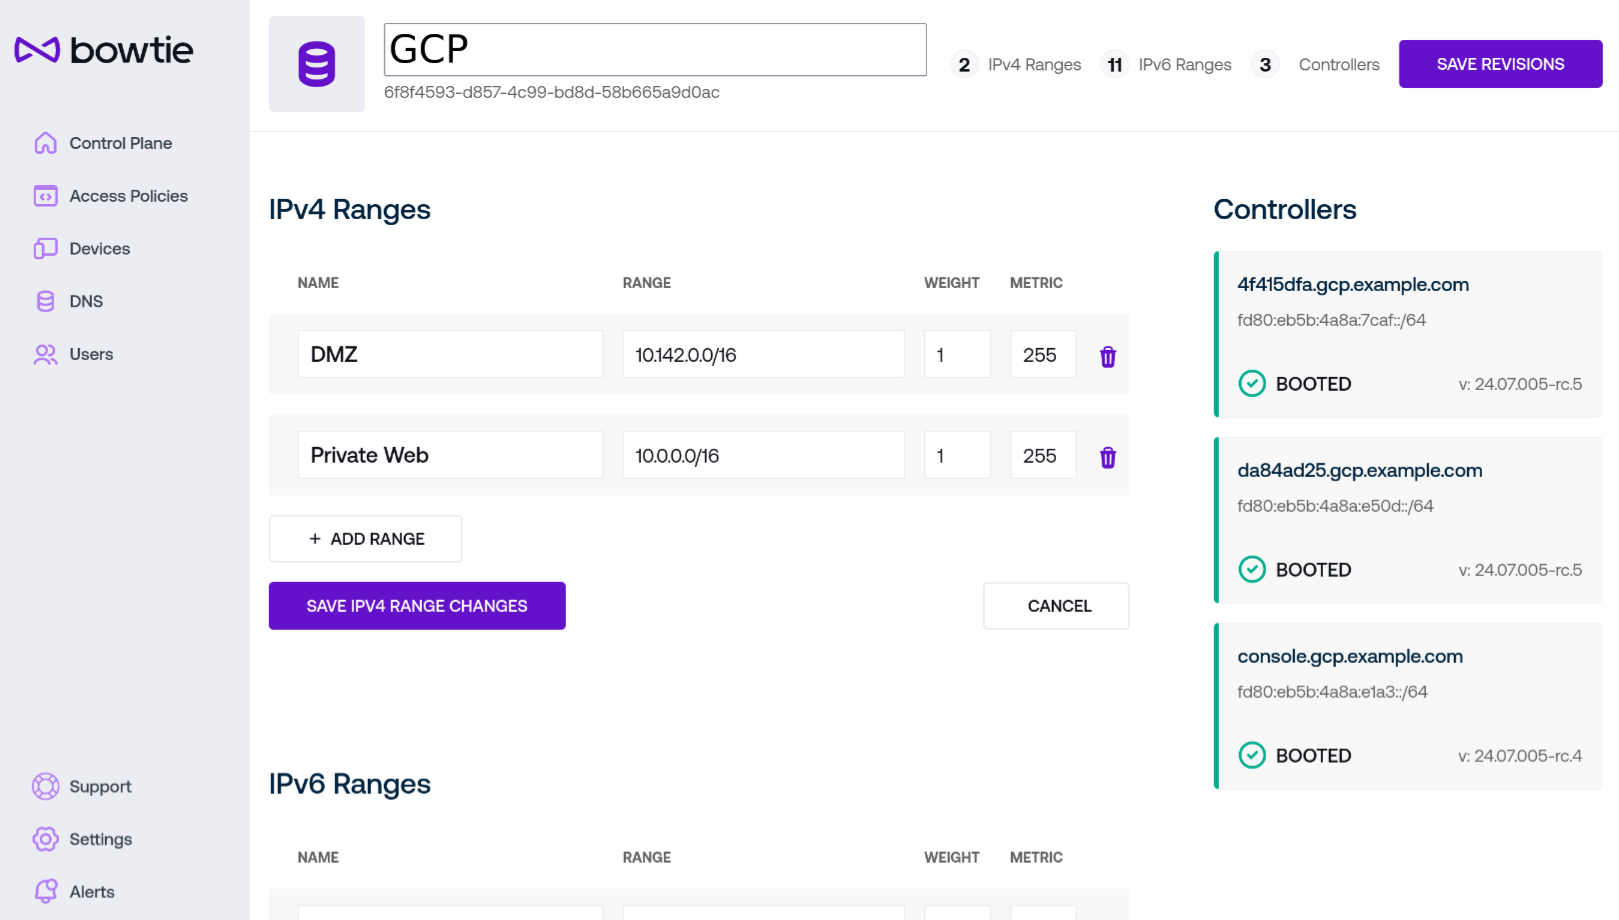
You may change the human-readable Name for the site at the top of the page if desired. Sites are identified internally by unique IDs, so this may be safely changed without impacting other resources.
Both IPv4 and IPv6 ranges may be added or removed from this interface. You may edit existing ranges by changing their fields, add new ranges by using the
Add Rangebuttons, and remove ranges by using the trash can icon to the right of each range’s fields. The following fields apply to both IPv4 and IPv6 ranges (which are listed after the IPv4 ranges):Name is a human-readable representation for the range. Sites ranges are identified internally by unique IDs, so this may be safely changed without impacting other resources.
Range is a typical network range in CIDR notation. Use the respective format for v4 versus v6 addresses for either section.
Weight may be used in future Controller updates.
Metric is analogous to the
metricnumber associated with routes in a typical routing table and so can be thought of as relative “cost” to traverse the route (whether number of hops, latency, and so on).
Once you have made any desired modifications, save your changes with the Save Revisions button at the top right of the page.
Controller Settings
Each Controller listed on the Control Plane page displays its hostname, address, current version, and last known state. Additional controls are available by clicking on its card in the web interface:
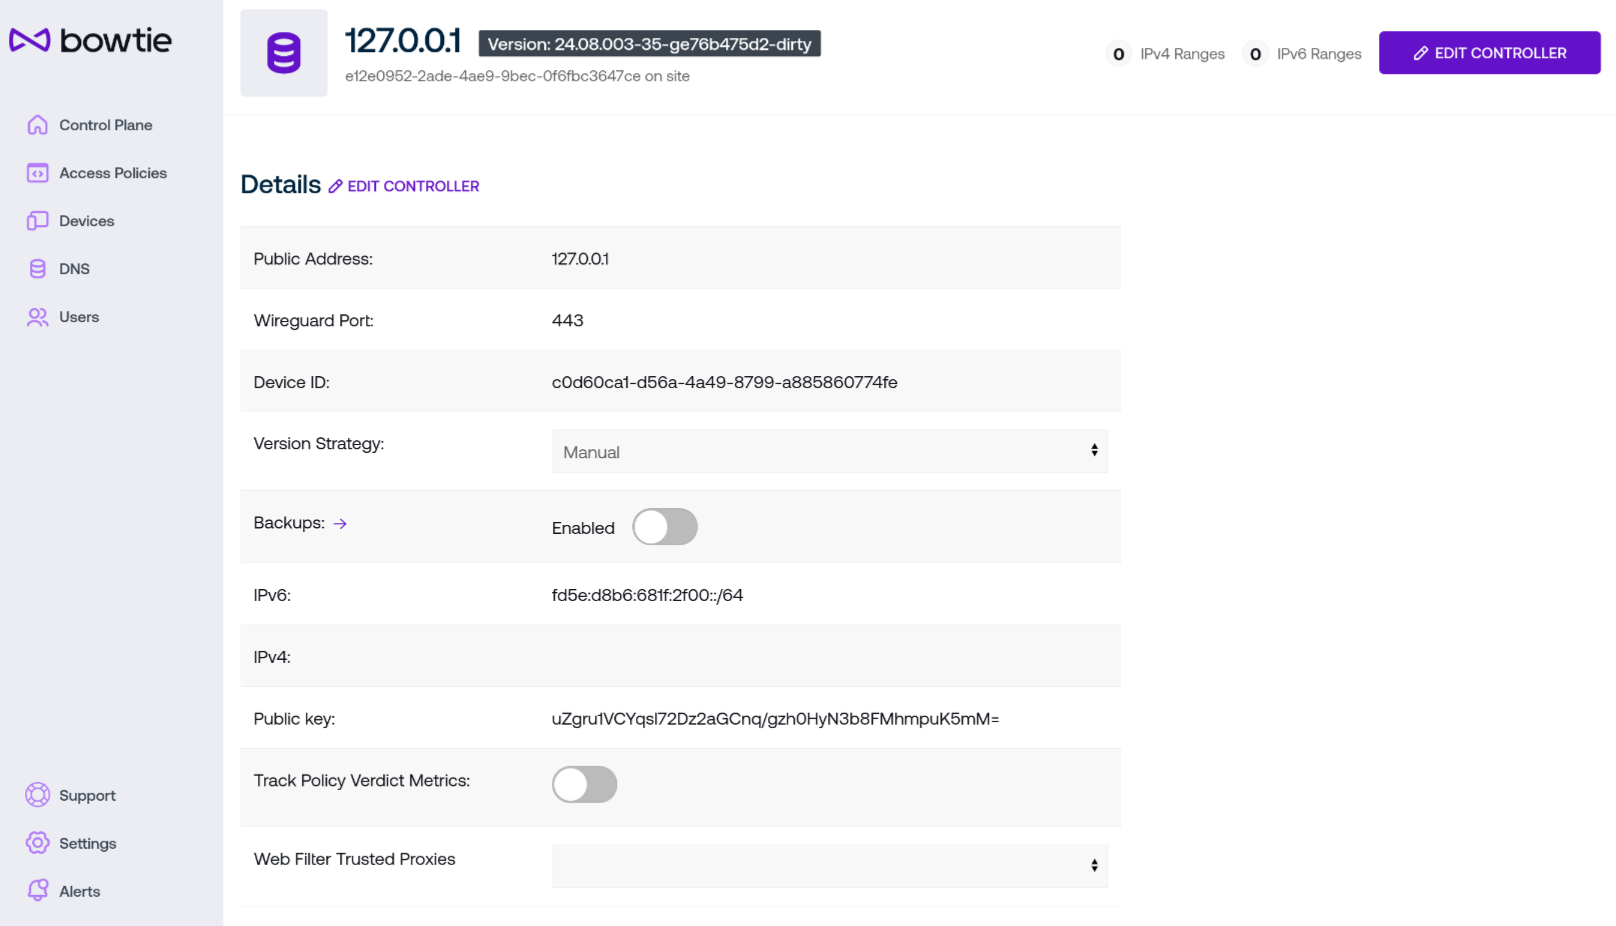
Along with the header containing the Controller’s hostname:
Public Address lists the publicly-addressable endpoint that the Controller may be reached from. Both Clients and other Controllers should be able to resolve this name and connect to the host from public networks for full functionality.
Wireguard Port lists the listening port for inbound VPN connections. Per Network Requirements, this port should be reachable from clients outside of the private network.
Device ID lists the Controller’s internal identifier for use over the Controller REST API.
Version Strategy permits administrators to dictate the automated update method that this Controller will use to perform regular system updates. The strategy listed here will take precedence over any steps taken under Automatic Update Examples and override those settings in favor of the strategy configured here.
Manual will prevent the Controller from performing any automatic updates. This strategy is discouraged because Controllers may miss important updates improving stability or security.
Fixed Version will configure the Controller to pin itself to the chosen version. No automatic updates will occur outside of ensuring that the indicated version is running.
Check for Latest at time will check for updates at the indicated time pattern. Strings should adhere to the systemd format for calendar expressions which permits for
cron-like expressions for repeating dates.Check for Latest periodically will check for updates at the configured interval beginning at the time this setting is updated. Strings should adhere to the systemd format for time spans which provides a flexible grammar for specifying duration times.
An advanced option is available in the drop-down menu to opt-in to pre-release versions of the Bowtie Controller software, which will be honored when the Latest at automatic update options are in effect.
Update Stagger Strategy accepts a string in systemd time span format. When automatic updates fire, the Controller will wait for some amount of time between zero and the time span indicated to begin updates. This provides a method to induce splay across a fleet of Controllers to avoid disruption when new updates are released. The consistently randomized option will behave as described except each Controller will consistently select the same random delay per-host so that checks will still occur within the chosen window but individual Controllers will retain consistent timings.
Version Minimum Age accepts a desired number of days to wait for new releases to age before moving to newer versions when choosing new versions under the version strategies that move to latest versions. This option may be desired for organizations that wish to preview releases or otherwise hold new releases back temporarily.
The maximum allowed age for this setting is 90 days.
Backups configure automated backups on a per-Controller basis. Click the toggle next to Enable to configure a backup repository. Use the arrow next to the Backups label to be taken to the Backups page.
Backup Encryption
Controller backups are encrypted. Before using the backup or restore capabilities for a Controller, you must define a valid encryption/decryption key (or password) for either the backup process or restoration process to use. Consult the Backup Encryption section for additional information.
Any settings that involve sensitive values, such as passwords or API keys, should instead be set via either Backup Encryption or Backup Settings. You should configure those settings before setting the options listed here. For example, if you define a backup repository for S3 but do not set either an encryption key or AWS credentials, backups will not run successfully.
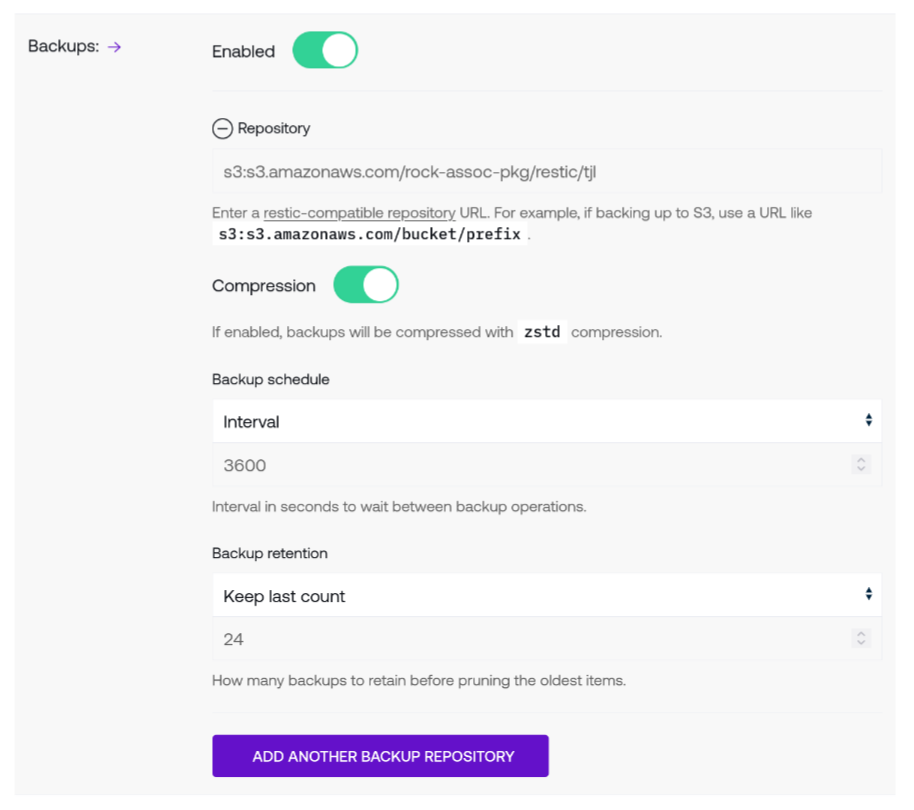
The repository field indicates where backup snapshots will be stored. Any restic-compatible repository string is accepted, including remote repositories like S3 or local directories such as
/tmp/backup, although remote repositories are recommended to remove single points of failure.Click on the minus symbol next to the repository name to remove a repository from the Controller’s backup configuration.
The compression toggle will instruct the Controller to compress backup snapshots. Both backup and restore processes treat compression transparently, so the specific compression algorithm is usually an implementation detail that does not require any end-user action (at time of writing, the compression algorithm is
zstd).Use the backup schedule to determine how often backups are taken. Two types of schedules are supported:
Use Interval to perform backups on a periodic basis based upon the previous backup action. This field is translated a number of seconds since the previous backup occurred.
Use Calendar to perform backups at a specific time of day. Any string compatible with systemd calendar events is supported. Consult its documentation for examples of valid calendar specifications.
Backup retention dictates how long to keep old backup snapshots. Two types of retention strategies are supported:
Keep last count will retain the indicated number of backups but delete any older backups past the indicated count. For example, keeping the last 10 backups will delete any backups older than the tenth backup.
Keep duration permits more fine-grained retention schemes that follow the restic duration policies as dictated by the
--keep-within <duration>flag. For example,2y5m7d3hwill keep all backups made in the two years, five months, seven days, and three hours before the latest (most recent) snapshot.
Click on the Add Another Backup Repository to add more than one backup repository. Each backup repository has its own separate and distinct endpoint, compression, schedule, and retention strategies.
To create or delete backup snapshots after configuring a repository, use the Backups page.
IPv6 and IPv4 addresses display the Controller’s current network addresses.
Knowledge of the Controller’s Public key is unnecessary for day-to-day operation but included here in case it becomes relevant during troubleshooting or diagnostics.
Track Policy Verdict Metrics will configure the Controller to record when policy verdicts are enforced (for example, accepted packets or dropped packets). These metrics can be retrieved either using the on-host Grafana instance or exported for consumption in another observability stack using the methods listed under Observability. Metrics are available from the Prometheus receiver in the
opentelemetry-collectorpipeline. Both this setting and Track Policy Verdict Logs may be enabled if both types of instrumentation should be reported. See Policy Verdict Tracking for additional information.Track Policy Verdict Logs will emit log events for each policy verdict decision as with Track Policy Verdict Metrics (but in the form of logs, not metrics). Note that deployments with high traffic volume should be prepared to handle the log volume associated with traffic flowing across the networking control plane. Both this setting and Track Policy Verdict Metrics may be enabled if both types of instrumentation should be reported. See Policy Verdict Tracking for additional information.
Web Filter Trusted Proxies has the same effect as web filtering trusted proxies but permits you to choose a specific collection that applies only to this specific Controller. Use the field to either create a new collection, choose an existing collection, edit an existing collection, or clear this setting.
Allow Temporary Console Users enables or disables Controller-level temporary console user access as outlined in Console Access. Both this toggle and the organization-wide setting must be enabled to create temporary users on a Controller.
SSH Listener allows administrators to restrict where inbound
sshconnections to this Controller are allowed to originate from. Defaults to the organization-level setting.
To edit a Controller’s settings, use the Edit Controller button at the top right of the page. After making any desired changes to the Controller’s settings, use the Save Changes button to persist the changes or Cancel to discard your edits.
Access Policies
The Access Policies page includes the following subsections in the navigation bar:
The DNS Configuration tab links to the DNS section of the control plane.
Policy Editor
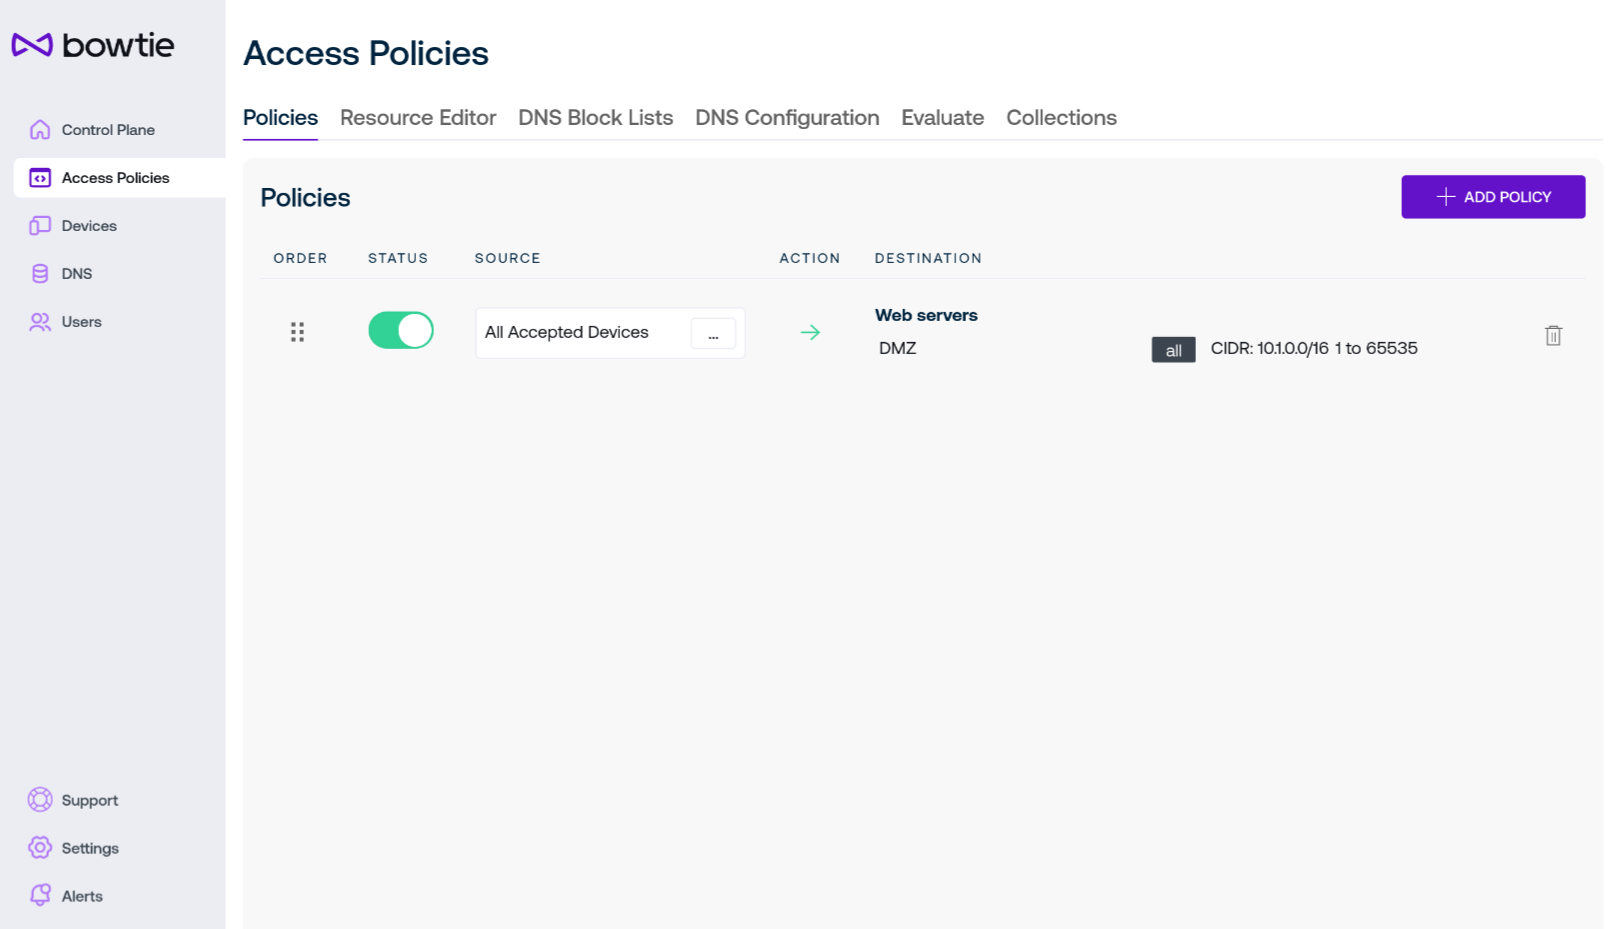
Policies are the central access control mechanisms that grant or deny access to your network resources. They map sources, such as devices or users, to resource groups and whether to grant access to those resources. Click Add Policy to open the interface if you would like to create a new policy:
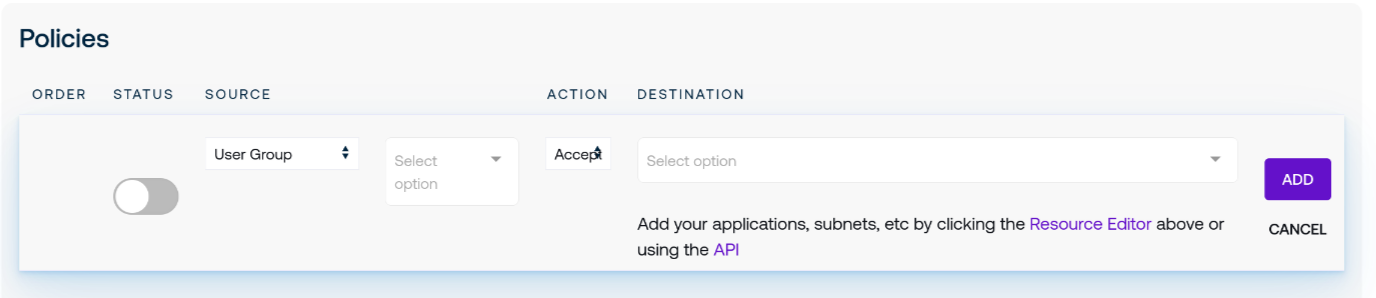
From this screen you may make selections for sources, the destination (in the form of a resource group), and what policy action to take, whether Accept, Reject, or Drop.
Use the Status slider to indicate whether this policy should be actively enforced.
Select the desired source to control its access. Accepted devices and authorized users are singular values, while groups for both devices and users present available choices in the text box immediately to the right of the Source drop-down menu.
Action can be thought of its firewall equivalent: Accept grants access to the indicated destination or resource group, Reject will respond to the requesting source with a denial, and Drop will silently ignore the traffic without passing it to the destination.
Note: the current implementation of policy enforcement treats both Drop and Reject as simply Drop. Future Controller improvements are likely to change this behavior to better reflect their descriptors.
Destination choices are drawn from any resource groups that you have configured either in the web interface or through the API.
Once a policy has been set, there are no additional steps to “flush” rules or otherwise mark them as actively enforced – changes are applied and propagated to other clustered Controllers and synced down to connected clients to either actively deny or grant access per the rules of the configured policies.
Delete policies by clicking on the trash can icon to the right of each rule in the table.
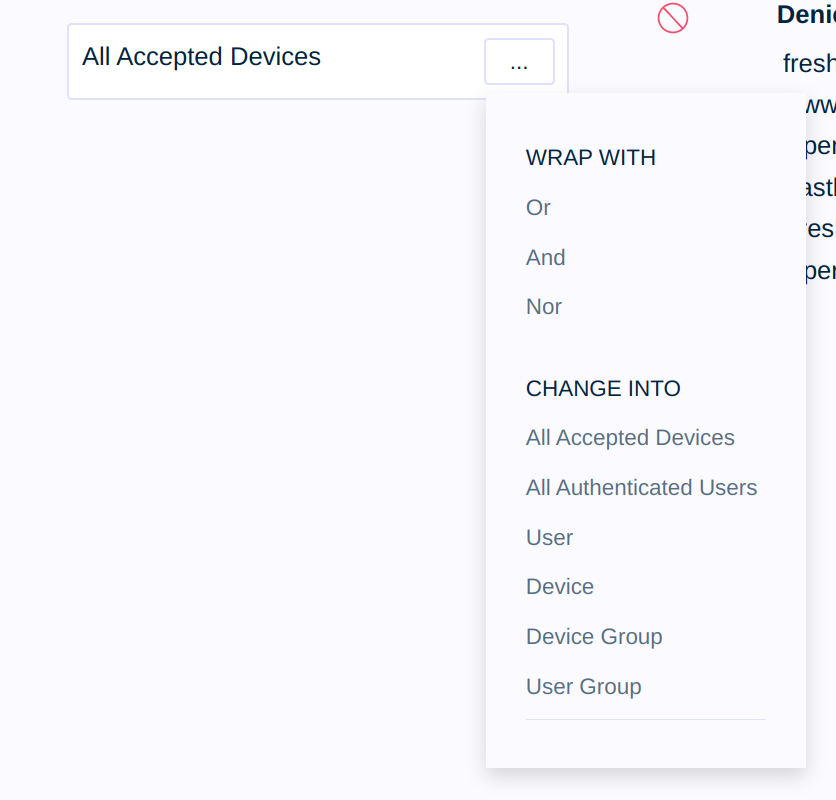
In addition to mappings from sources to destinations, you may also compose flexible combinations of sources to create more expressive rules. To begin, click on the ellipses to the right of the source for an existing policy source.
In addition to changing the source in-place, you are presented with optional buttons to wrap the policy to encapsulate additional logic. Different sources may be combined into a relationship with conditions for or, and, or nor.
Using or as an illustrative case, selecting the Or option from the drop-down menu presents you with a new Save button directly beneath the policy rule’s source name. Select it to turn the single-source policy rule into a rule with additionally composed rules.
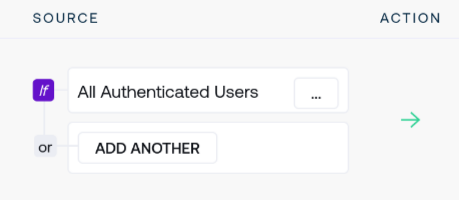
The policy rule is still enforcing All Accepted Devices in this state but additional sources may now be added and policy decisions will be based upon whether the source is an accepted device or a source chosen to combine with the rule.
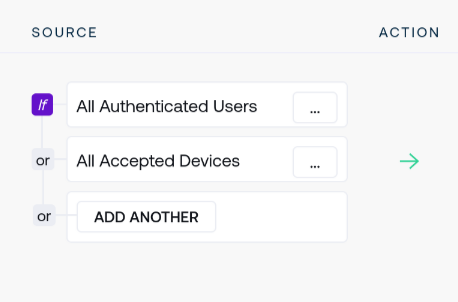
As an example, click Add Another to add a second rule to combine with or logic with the existing All Accepted Devices source. A second source appears derived from the first:
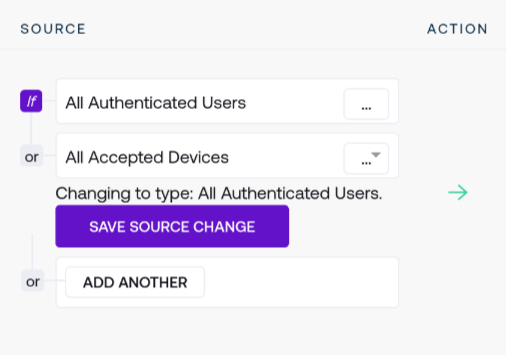
Opening the context menu for the new source by clicking on the ellipses opens options to change this new rule to any desired source. For example, selecting All Authenticated Users presents the option to confirm this choice:
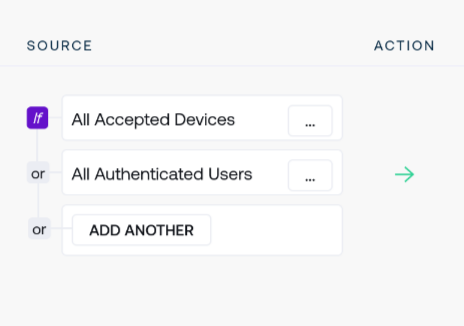
Confirming the change creates the new combined policy rule:
Remove wrapped logic operators by using the Delete button at the bottom of the contextual drop-down menu.
Resource Editor
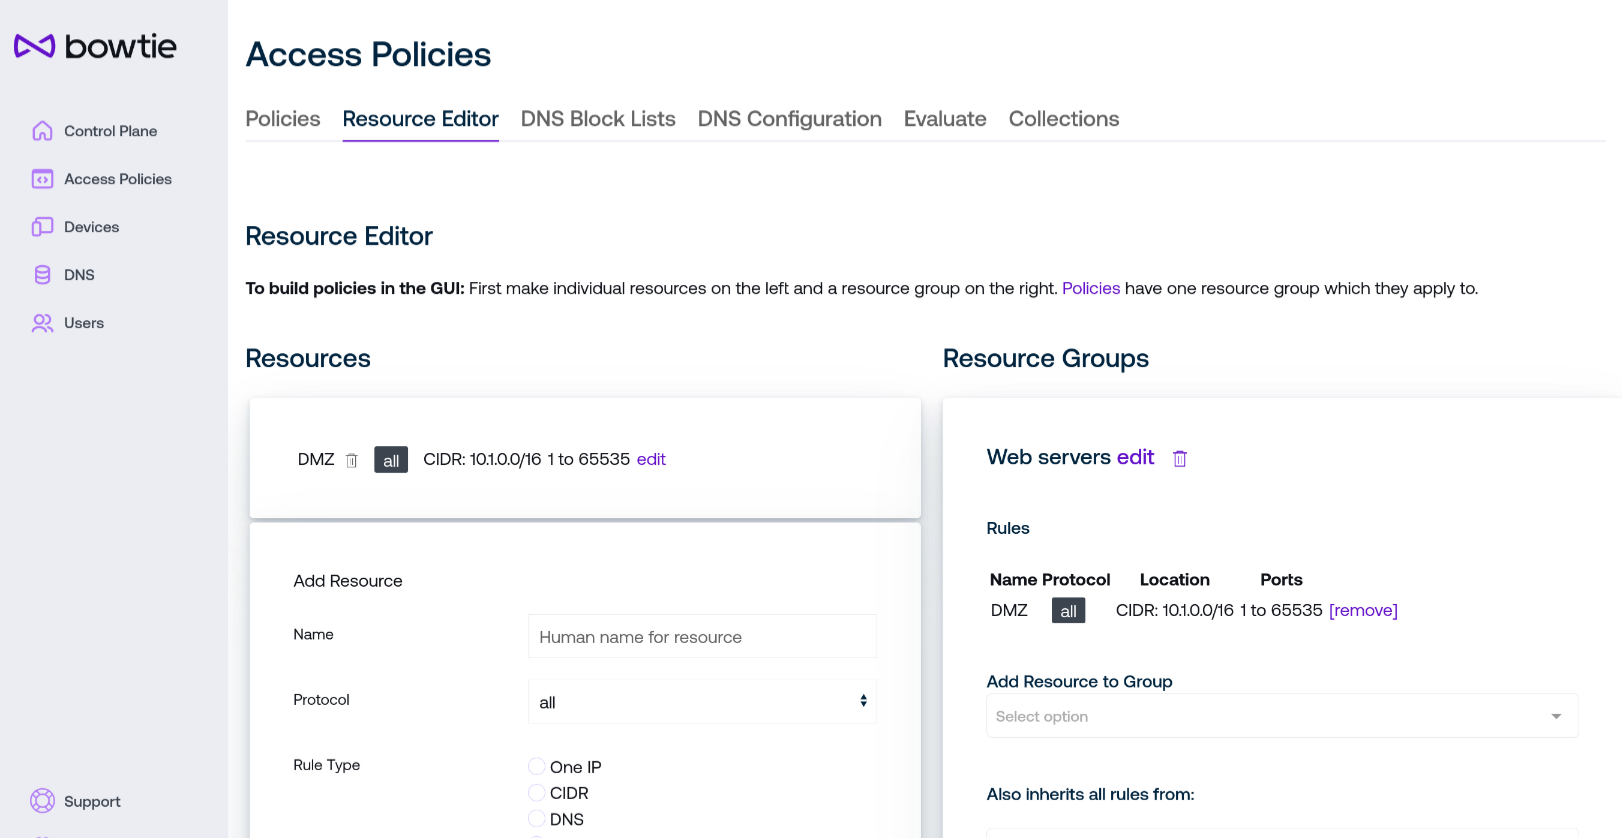
Create destination groups for policies using the resource editor tab of the Policies page.
Two columns are listed on the resource editor page:
On the left, define resources based upon their protocol, address, or port.
On the right, collect resources into groups that policies can grant or deny access to.
To begin, scroll down to the Add Resource card and configure the settings for the network resource you would like to control access to:
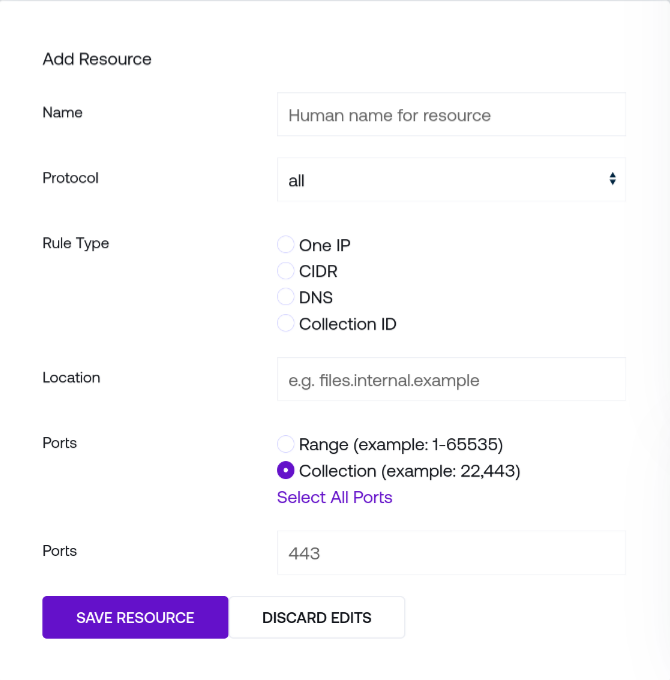
Name is a human-readable name to identify the resource in the web interface. Resources are identified internally by unique IDs, so this may be safely changed without impacting other settings.
Protocol will enforce access to this resource based upon the indicate type. For example, choose
httpsfor browser-based access to a resource.Rule Type dictates the form of Location for this resource: for example, One IP controls access to the singular address denoted in the Location text box, CIDR permits you to dictate a network range in CIDR notation, and DNS controls access to specific network names.
Location may be a singular network address, network address range, or DNS hostname (based upon the chosen type of Rule Type)
Ports control which ports will be matched for this resource. Both ranges and comma-separated lists are supported, or you may Select All Ports to pre-fill the entire range of addressable ports.
Once finished, click the Save Resource button at the bottom of the Add Resource card to create the resource.
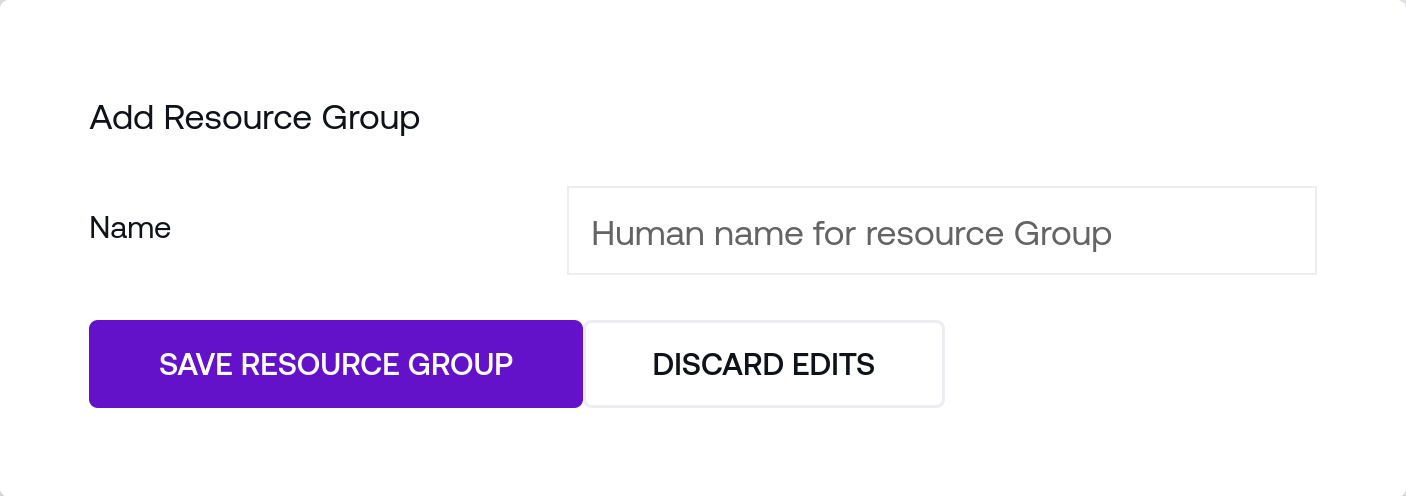
Before using the new resource, you will need to create a Resource Group to add it to, which are managed in the right-hand column. Scroll down to the bottom of the page and choose a human-readable name for the new resource group and click Save Resource Group to create it:
To add resources to resource groups, click the Add Resource to Group drop-down to select one or more resource to add.
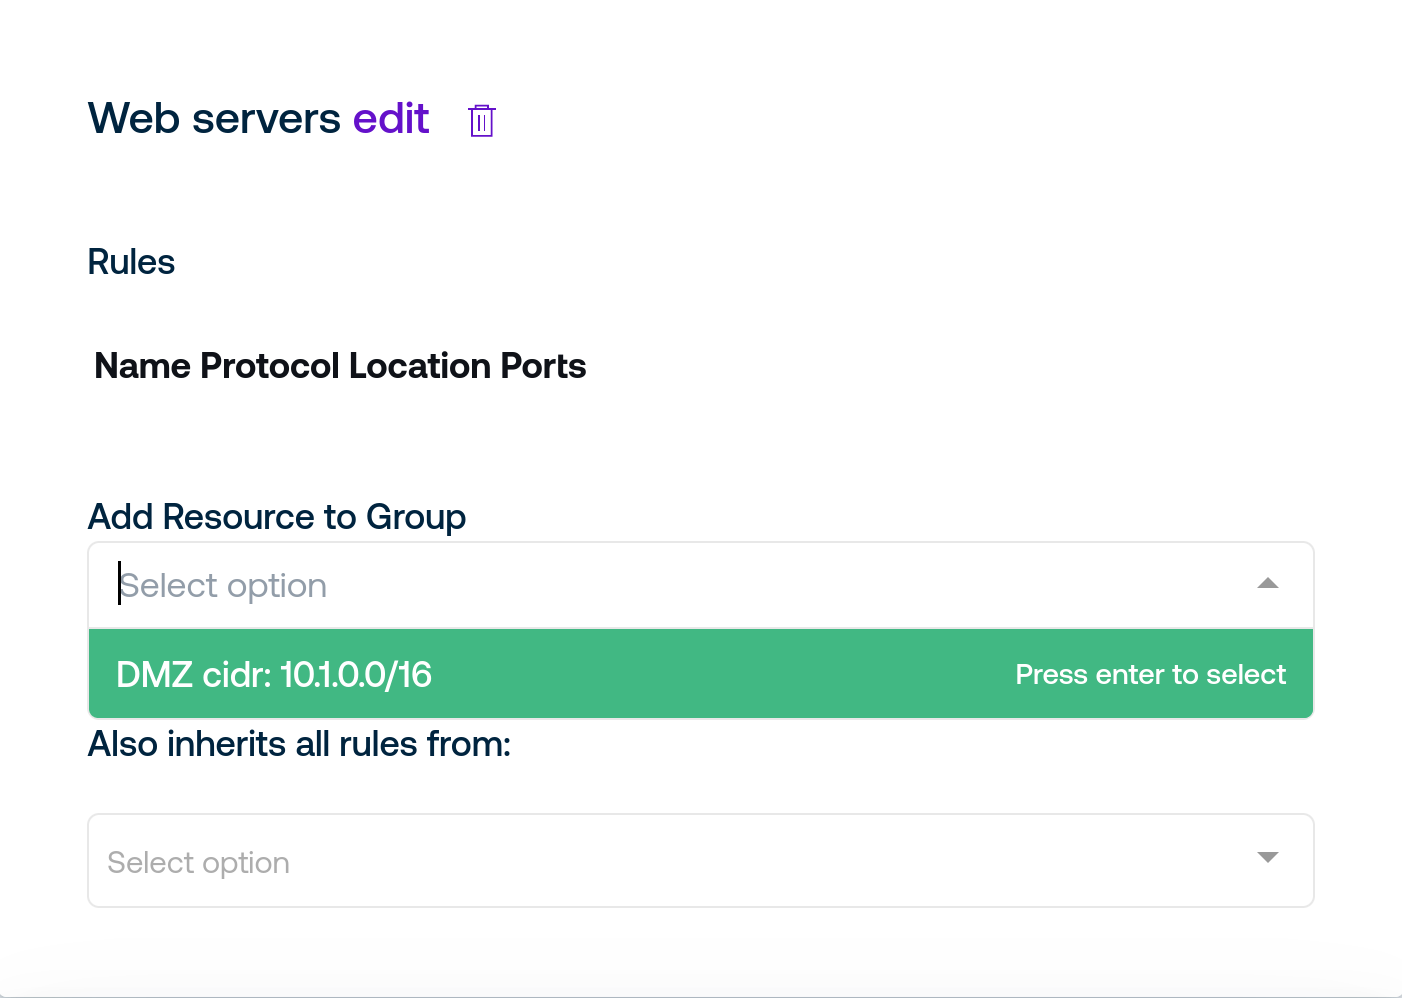
Multiple resources can be added to resource groups to group similar resources for use by Access Policies. Once you have created the desired resources, the policies page can control access to them.
DNS Block Lists
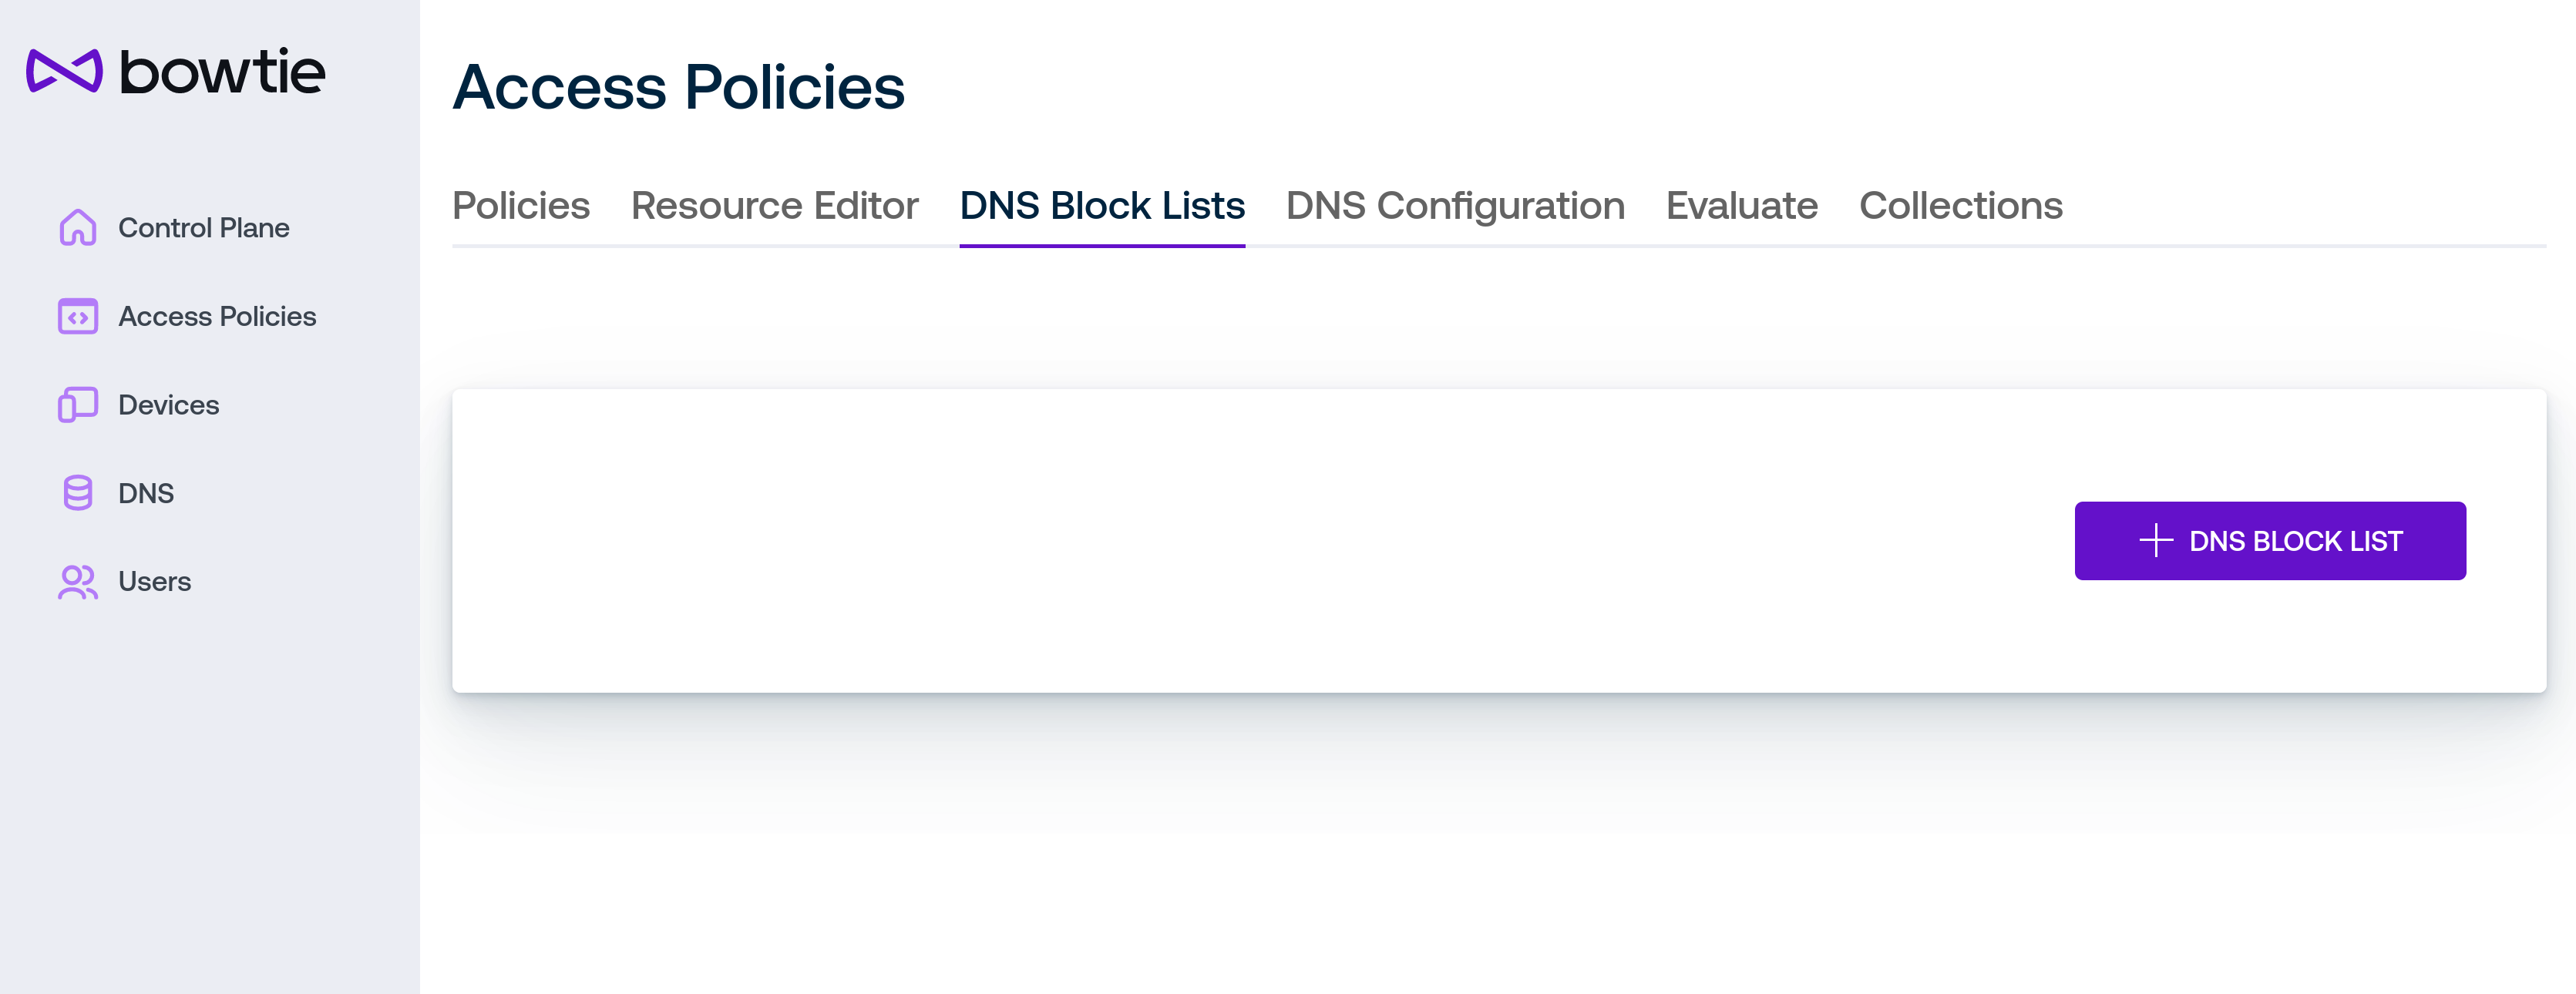
The DNS Block Lists tab of the Policies page provides an interface to load and use arbitrary hostname block lists assembled from either remote URLs or static lists. Block lists offer one method for enforcing network-wide policies to block known-malicious domains from open source lists, for example.
To create a block list, click the DNS Block List button. A modal dialog with options will open:
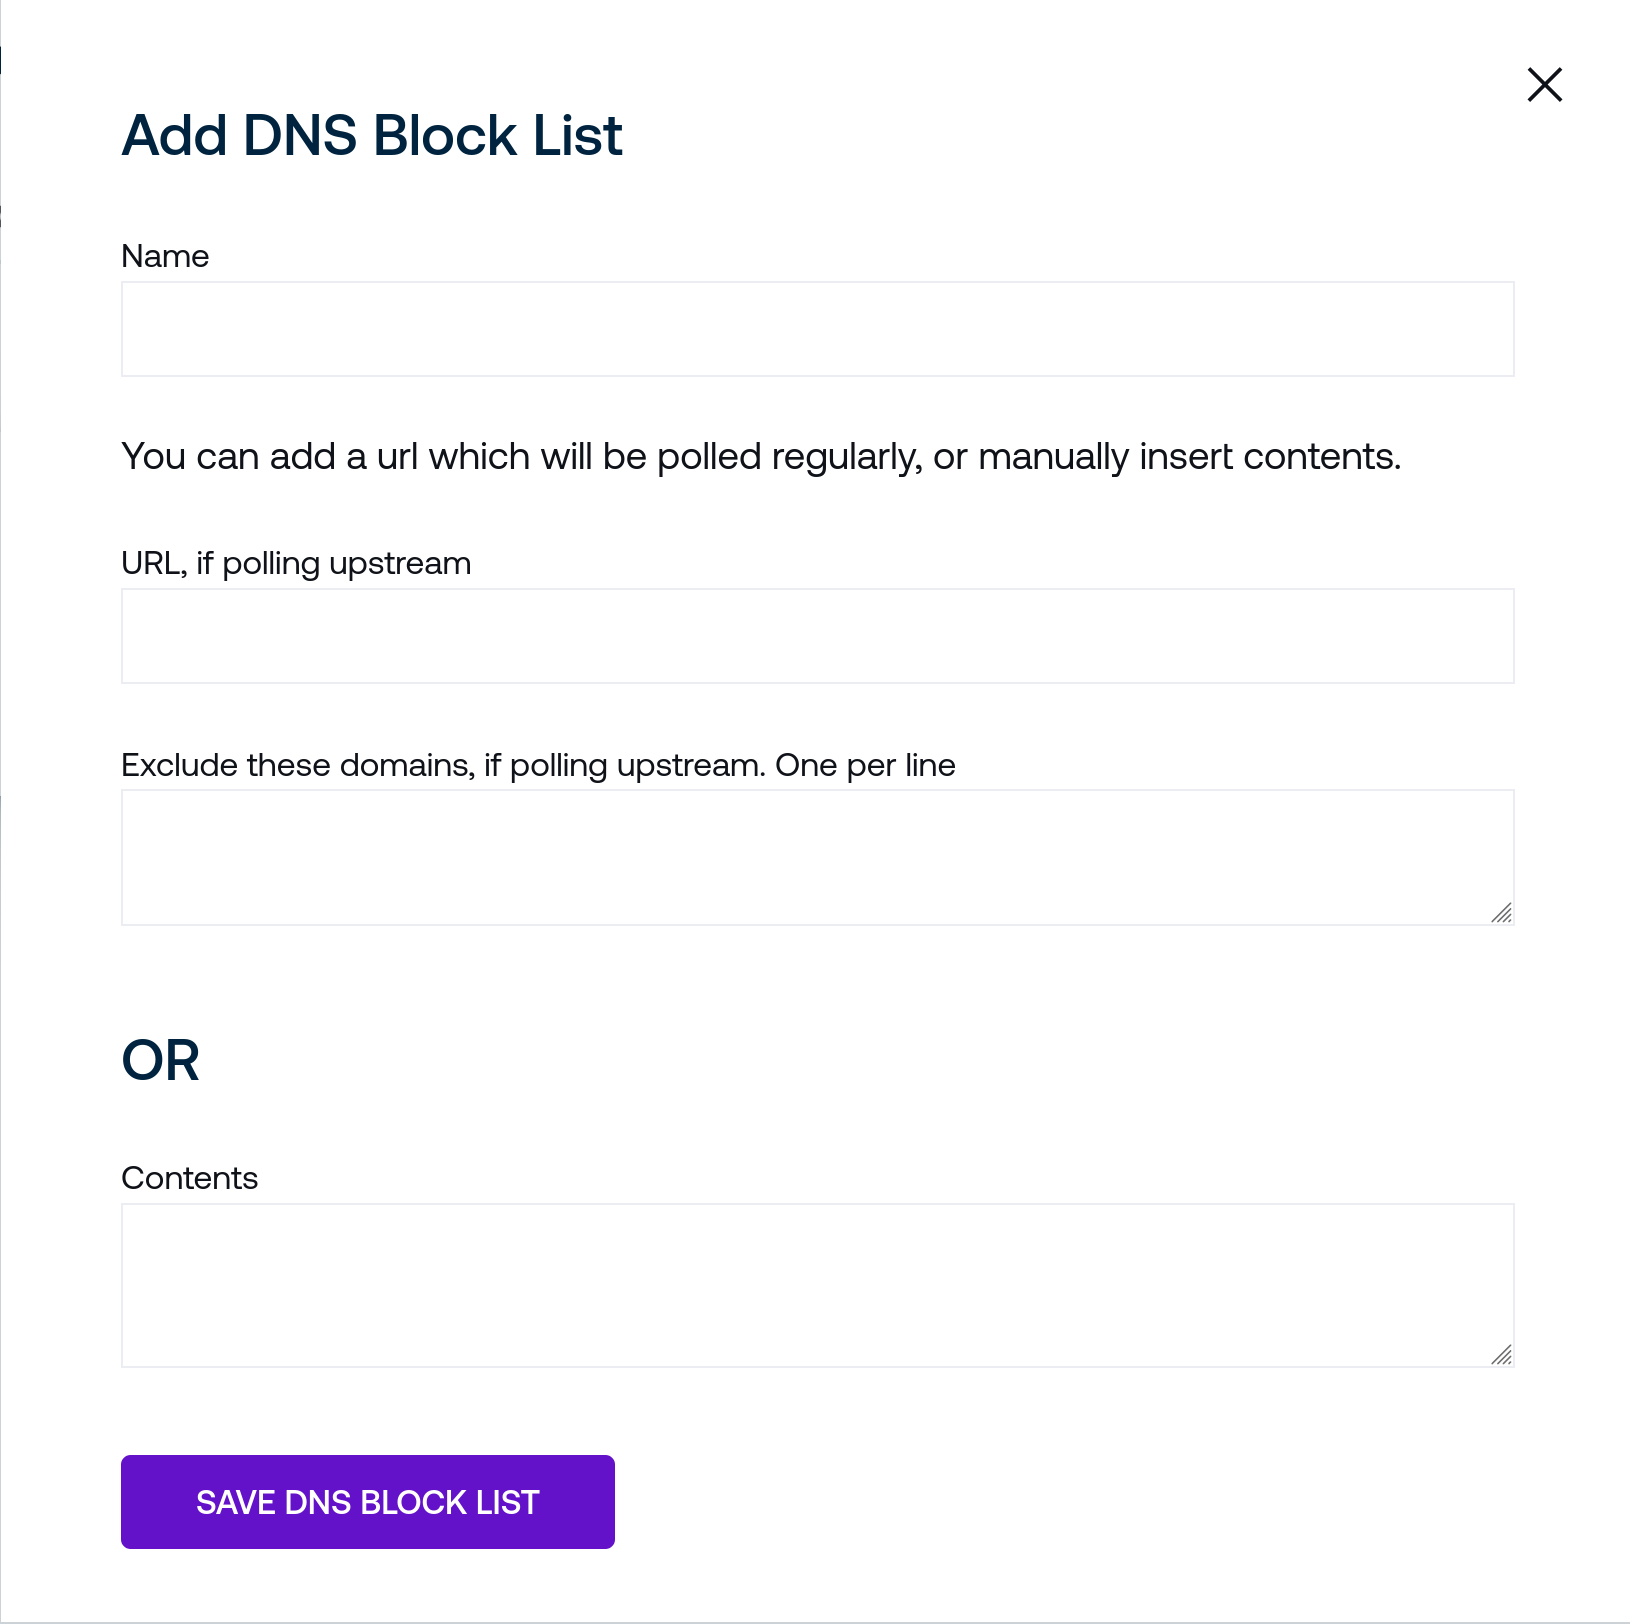
Name is a human-readable name to identify the blocklist in the web interface. Block lists are identified internally by unique IDs, so this may be safely changed without impacting other settings.
The URL field accepts a remote URL to poll periodically that contains a list of hostnames. The contents of the remote file should contain a newline-delimited list of hostnames. Connected clients will block each hostname found in the blocklist.
Exclude accepts a list of hostnames to exclude from the DNS blocklist. For example, if the upstream URL blocklist file includes the line
example.combutexample.comis listed in the Override field, the domain will be ignored from the DNS blocklist andexample.comwill continue to resolve normally.If you would prefer to provide a DNS blocklist as a static list of strings, you may fill the Contents field with the equivalent contents of a remote DNS block list. For example, the following block of text in the Contents field would block
example.comandhackertyper.com:example.com hackertyper.com
Once you have filled in the desired fields, click Save DNS Block List to create the block list. A new block list will appear in the list view.
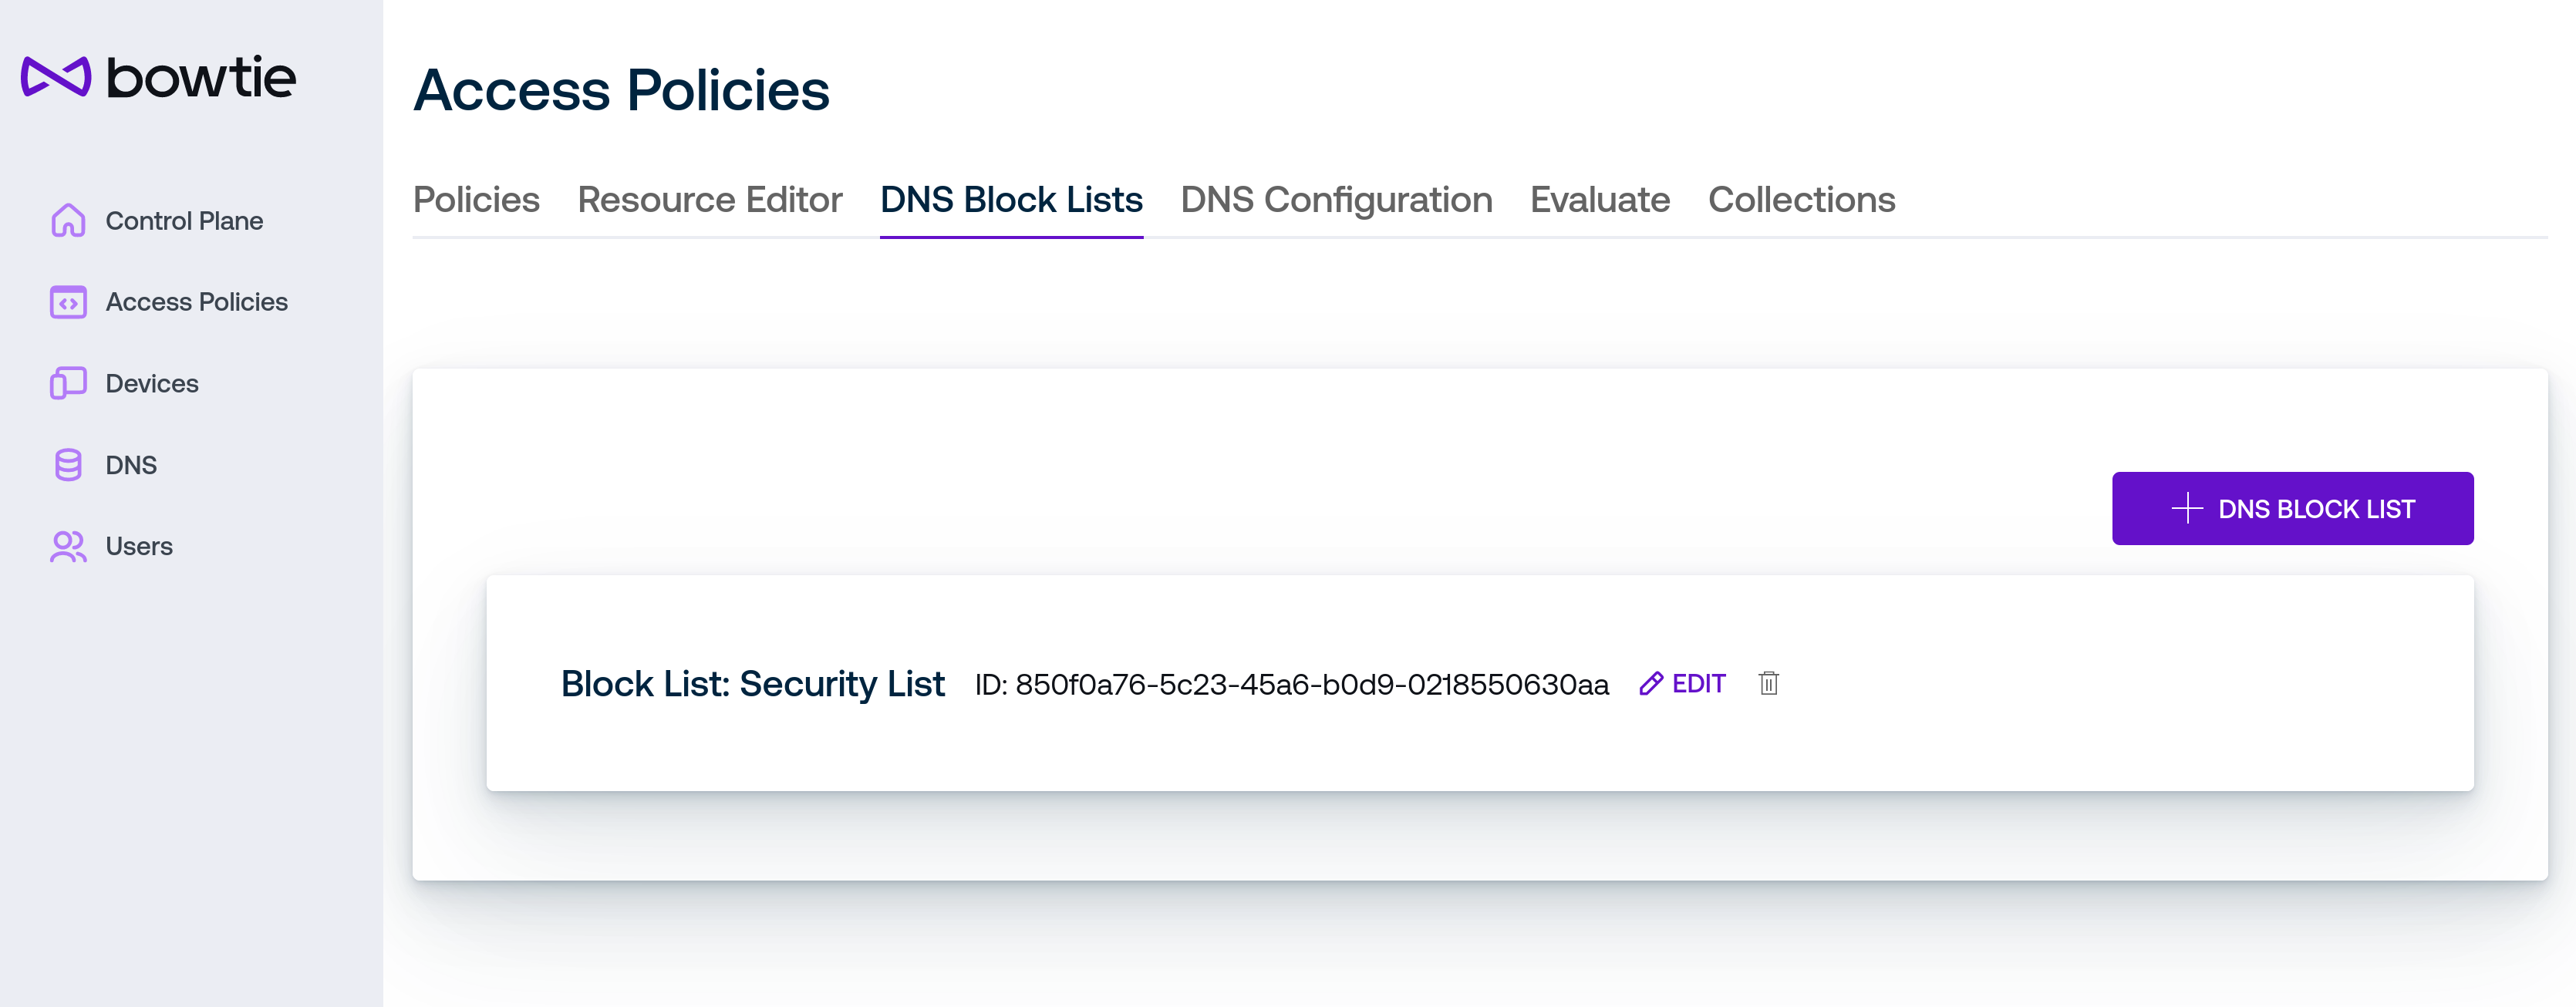
The Edit permit permits changing any of the aforementioned fields. Use the trash can icon to remove the associated block list item.
Fine-grained settings for DNS block lists, such as the fetch interval and execution strategy, are available on the Tasks tab of the Settings page.
Policy Evaluator
Evaluator Beta
The policy evaluation interface is a beta preview and subject to change as it undergoes additional iterations and improvement.
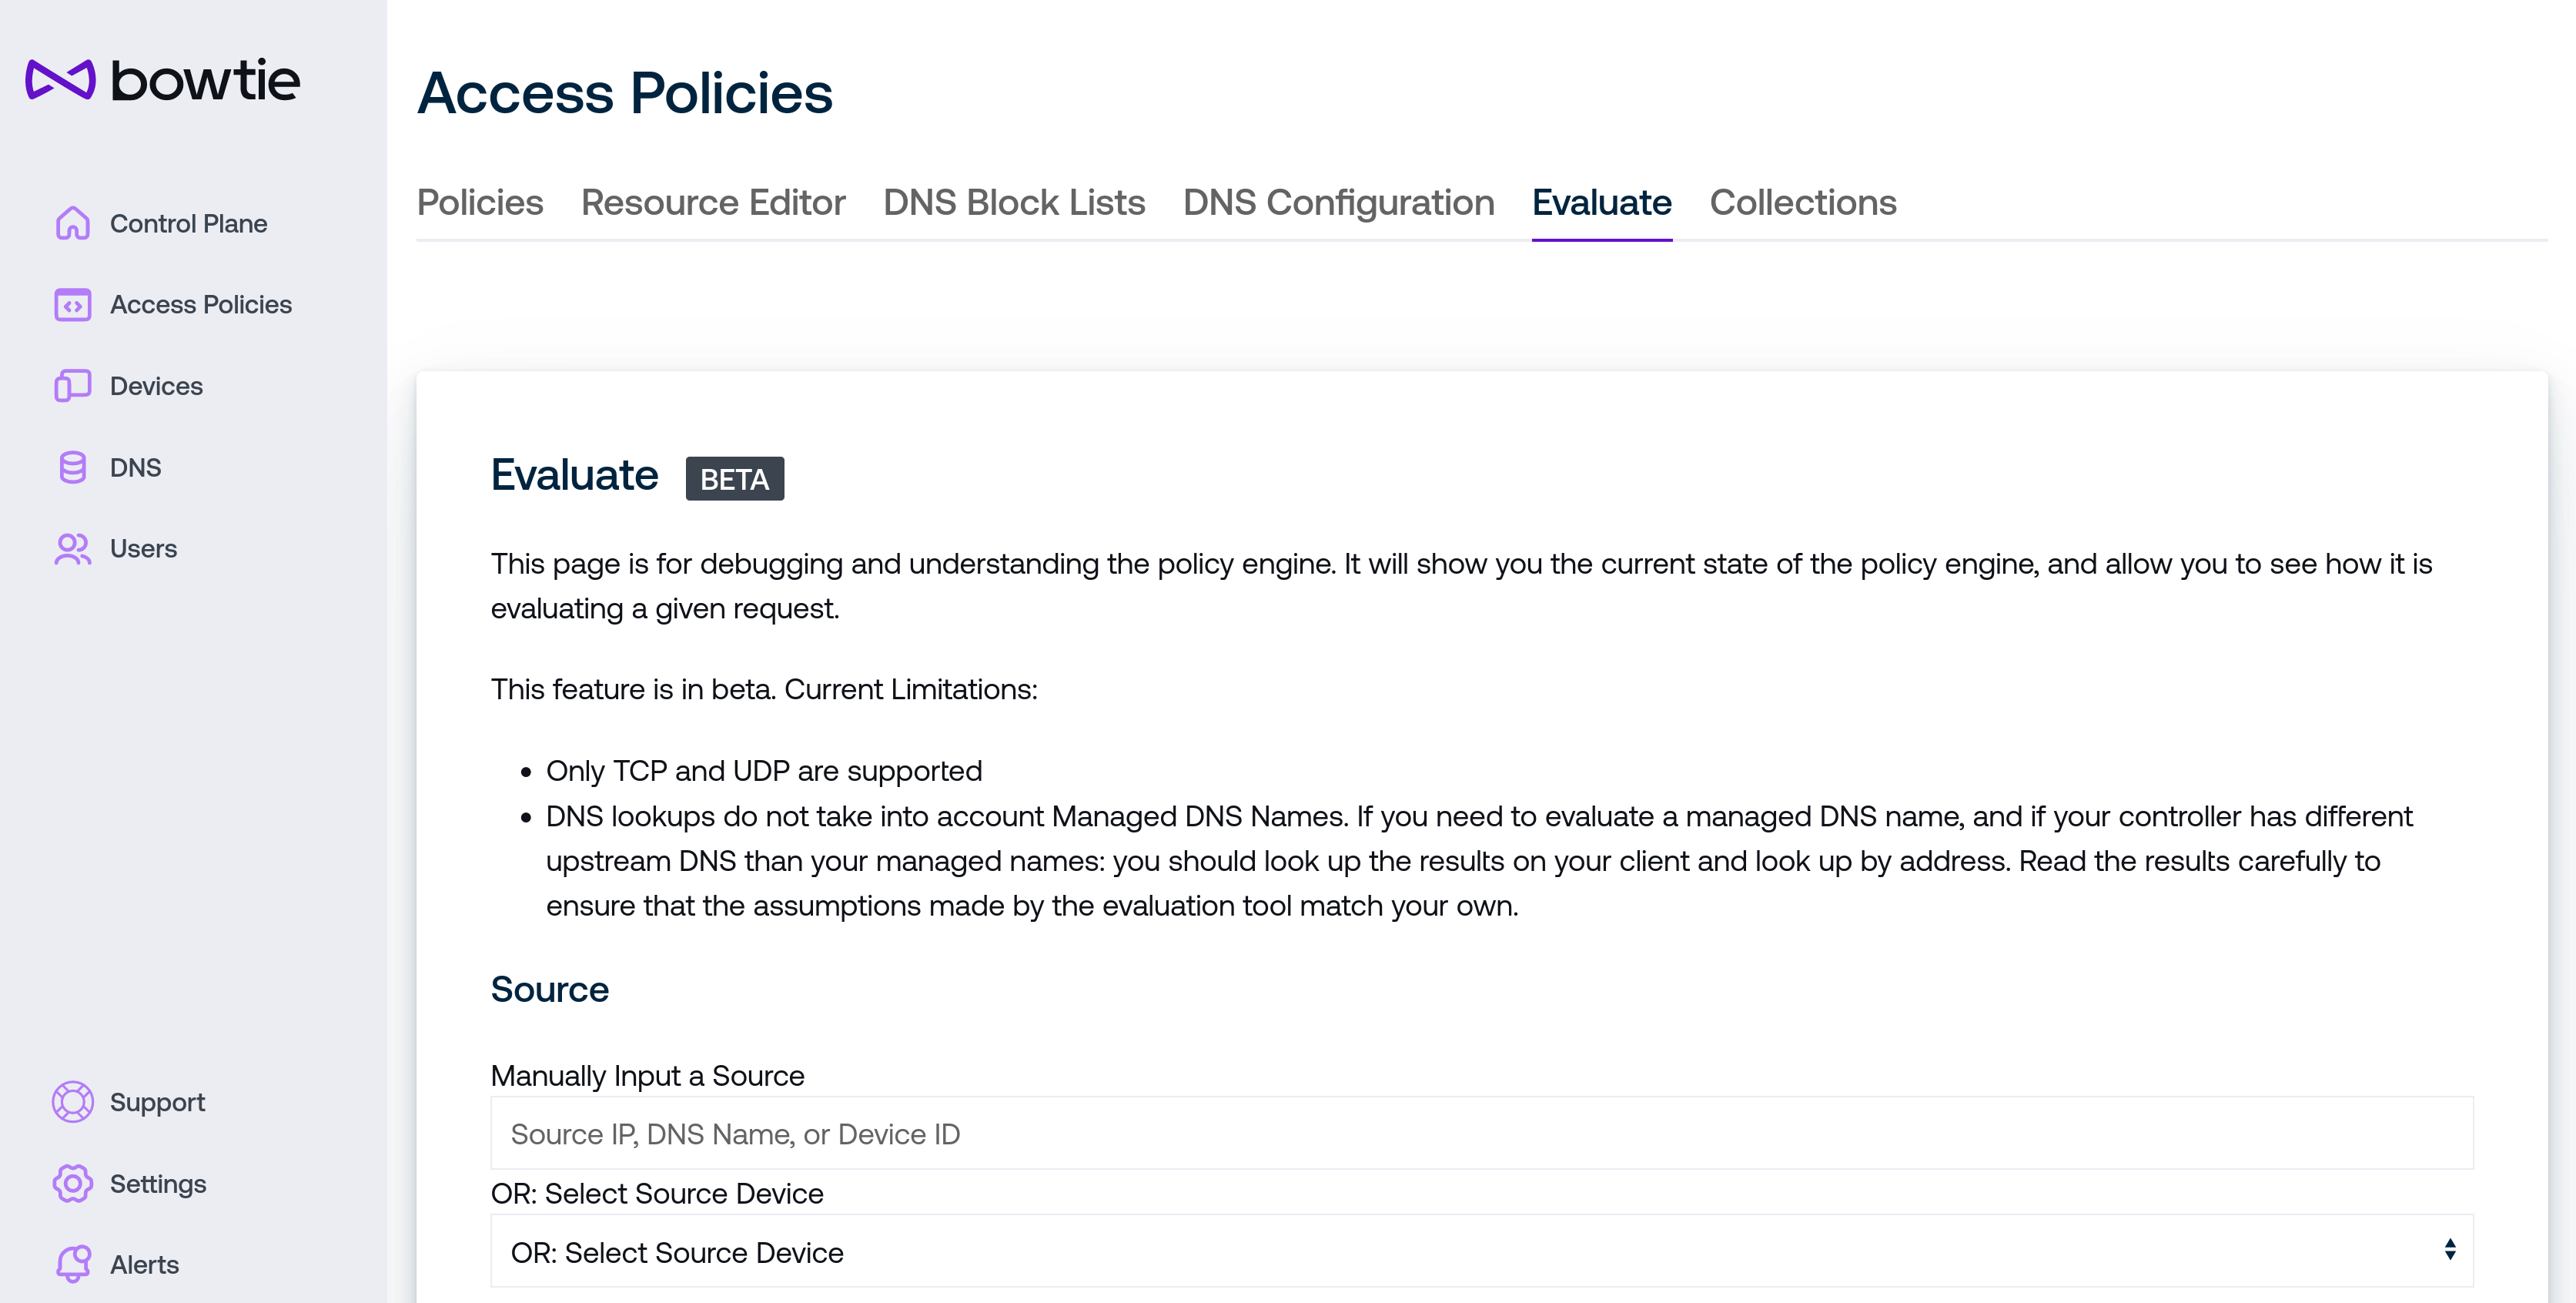
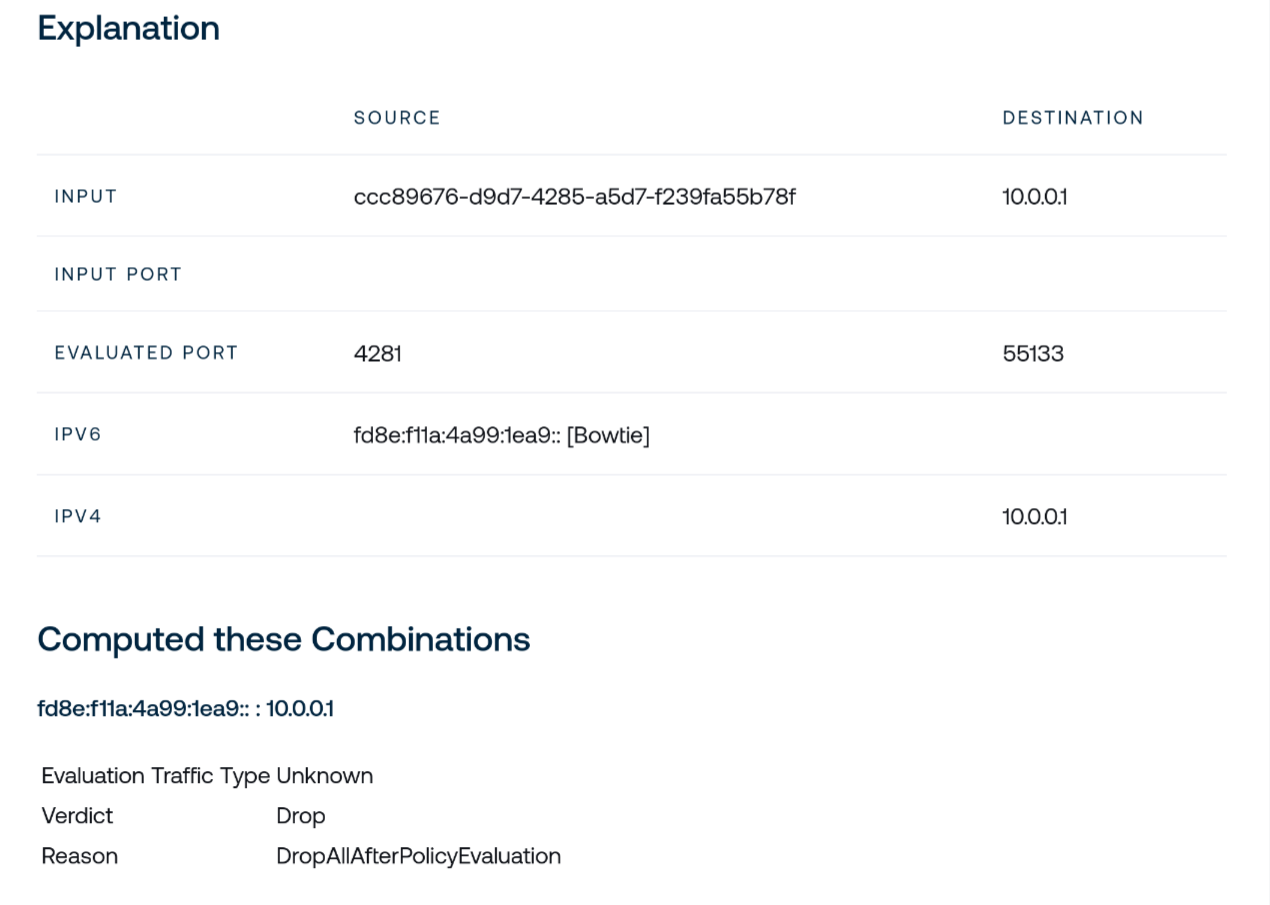
The policy evaluator is a diagnostics tool intended for use by administrators to better understand how the policy engine makes decisions about network traffic over your Bowtie control plane. Given a hypothetical source and destination, the evaluator will consult your policies to return the resulting decision that would take place if real-world traffic with matching criteria were to flow through your control plane.
Under Source you may enter either a free-form network address or select an existing device known to your Controller.
If desired, you may also enter a source port to factor into the evaluator’s policy decision.
Under Destination, enter a destination network address, optional port, and protocol.
After entering your sample criteria, click Evaluate to generate a computed explanation for how your speculative traffic would be handled by your active policies.
Collections
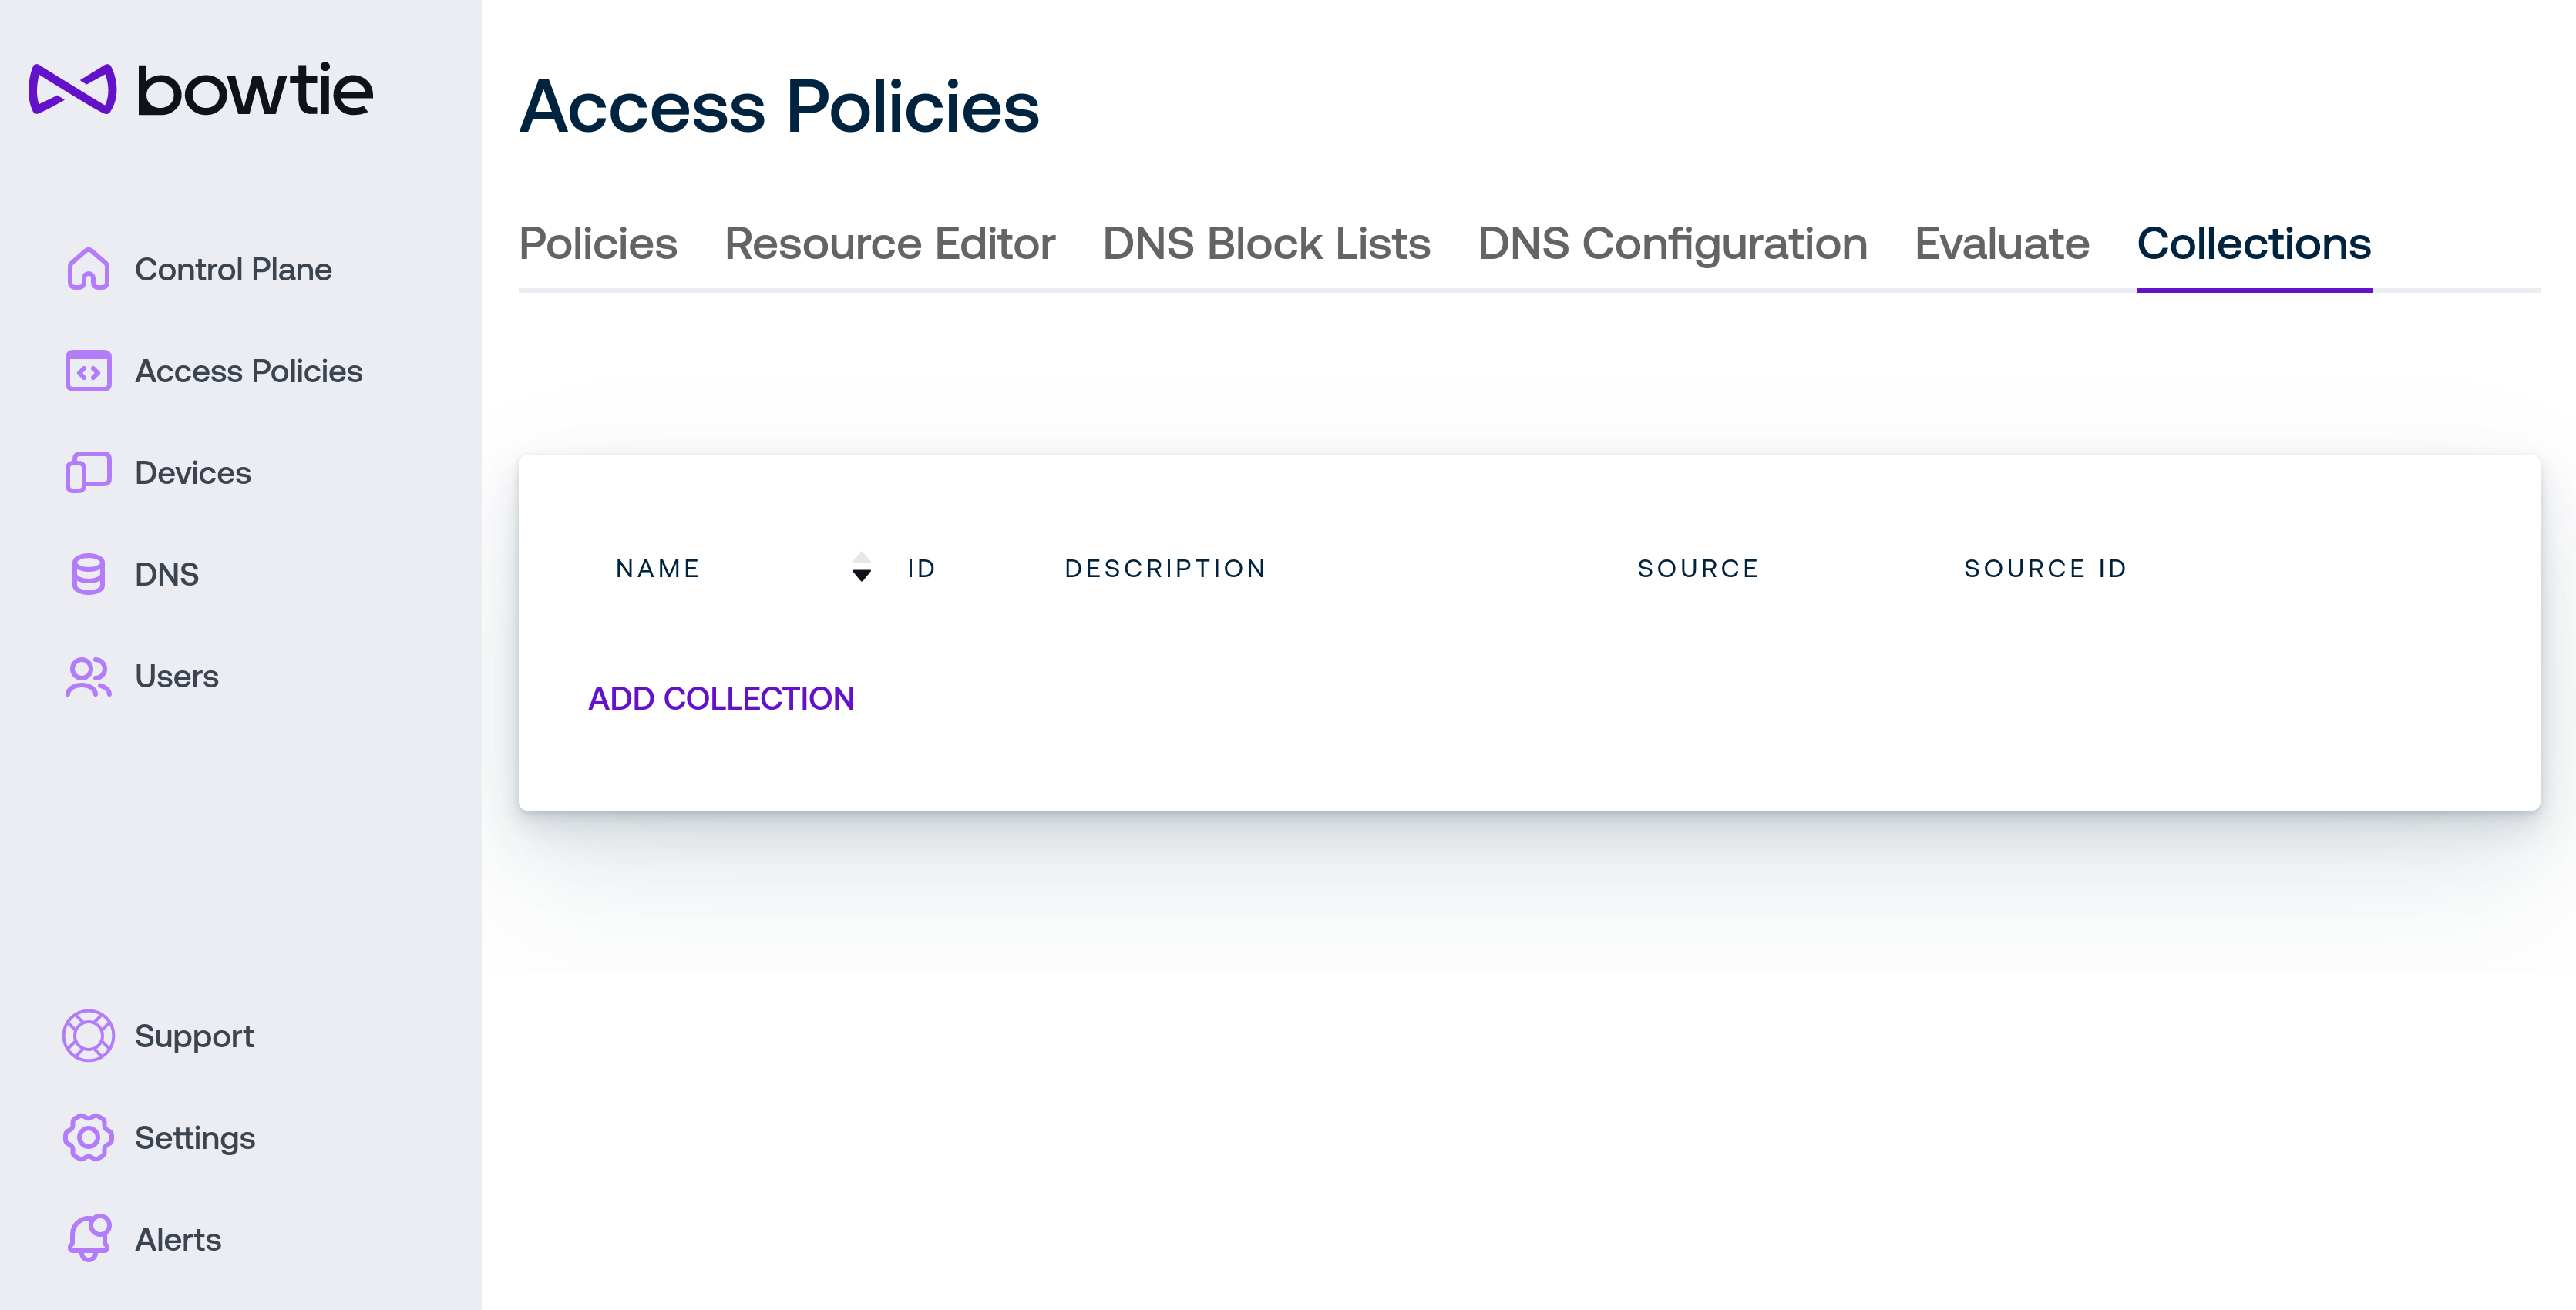
Use Collections to group like API resources together for simpler management over the Bowtie API. By grouping one or more destination type under a single collection, you may re-use common definitions to simplify policy management.
From this interface you can add, edit, and delete collections.
Collections Beta
Collections are under active development and are currently only available for use in either web filtering or the policies REST API.
For example, click Add Collection to add a collection by filling out the fields:
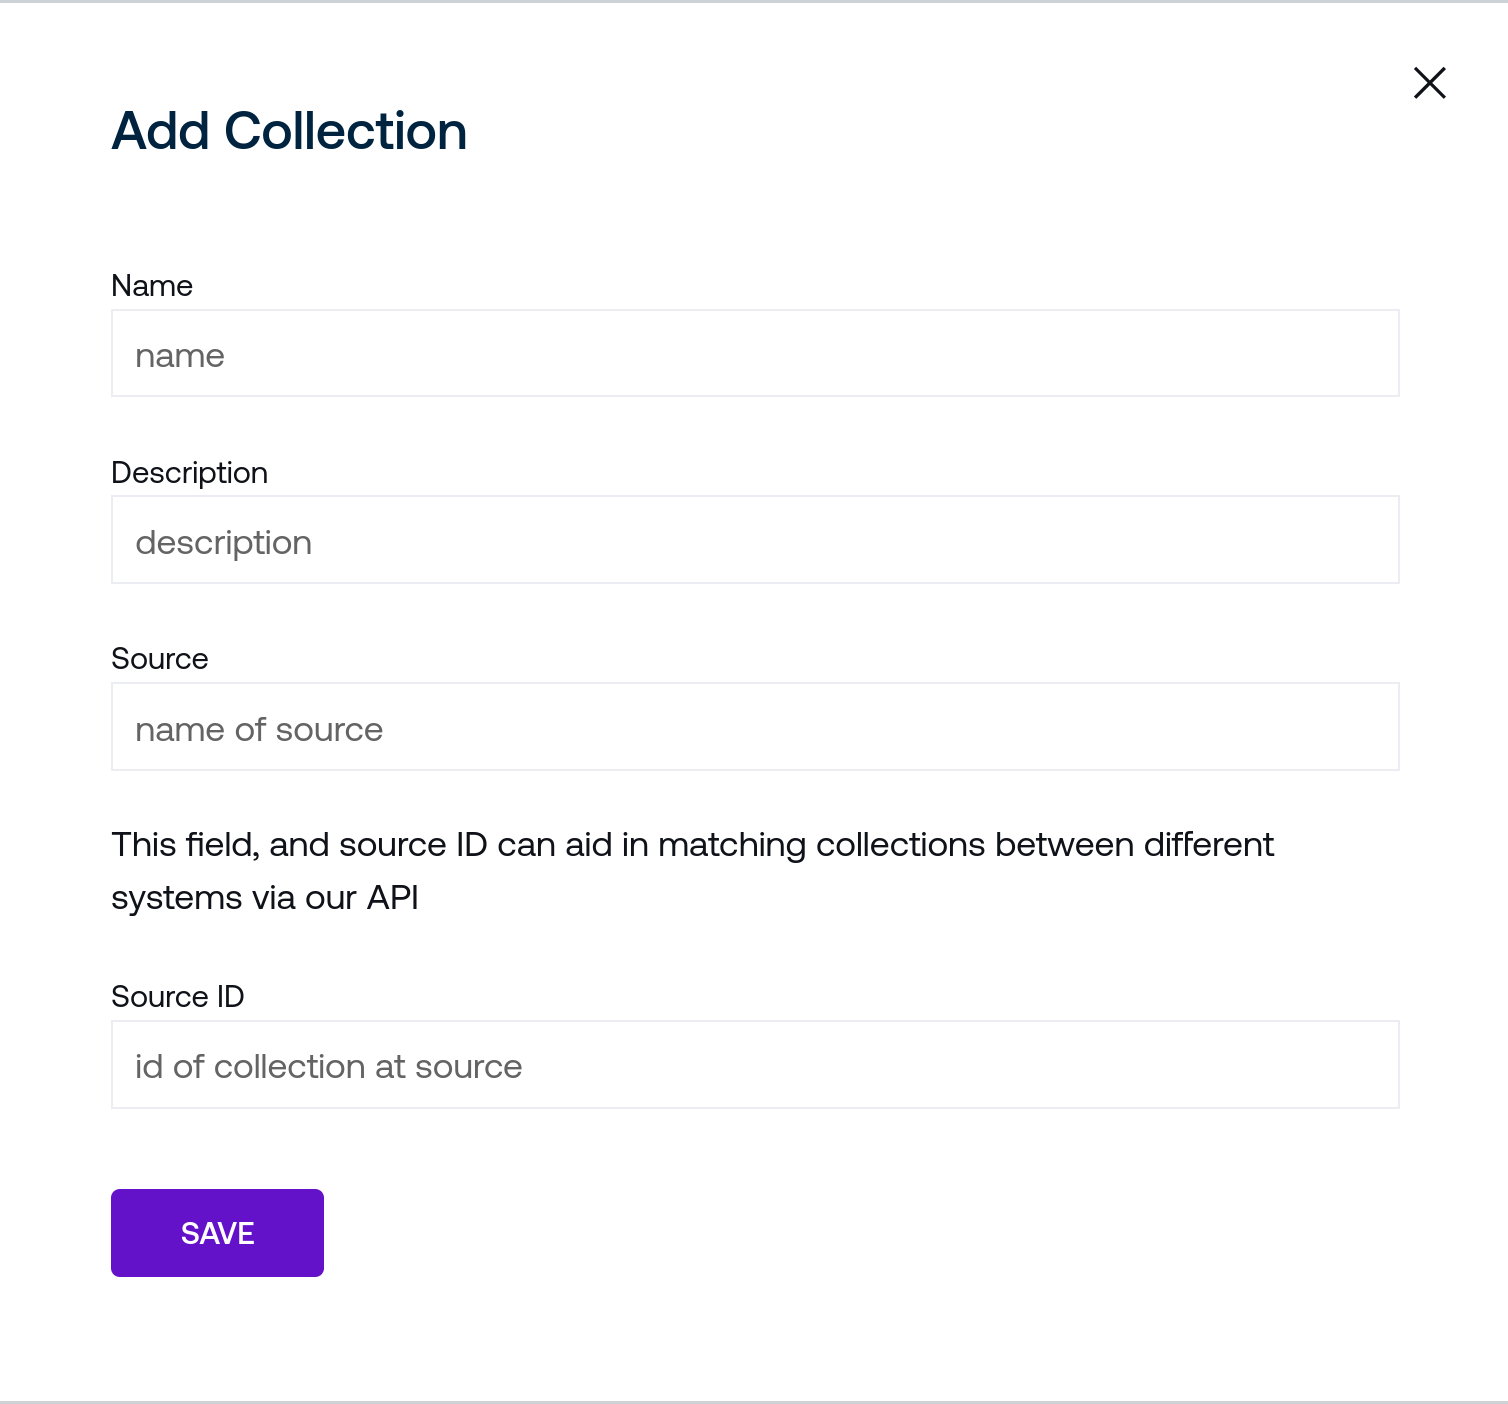
Name is a human-readable name to identify the collection in the web interface. Collections are identified internally by unique IDs, so this may be safely changed without impacting other settings.
Description is also a free-form text field for administrator use.
Source is an identifier used when referencing this collection when constructing resources for use in policies.
Using the Change Membership link brings you to the detailed page for the collection:
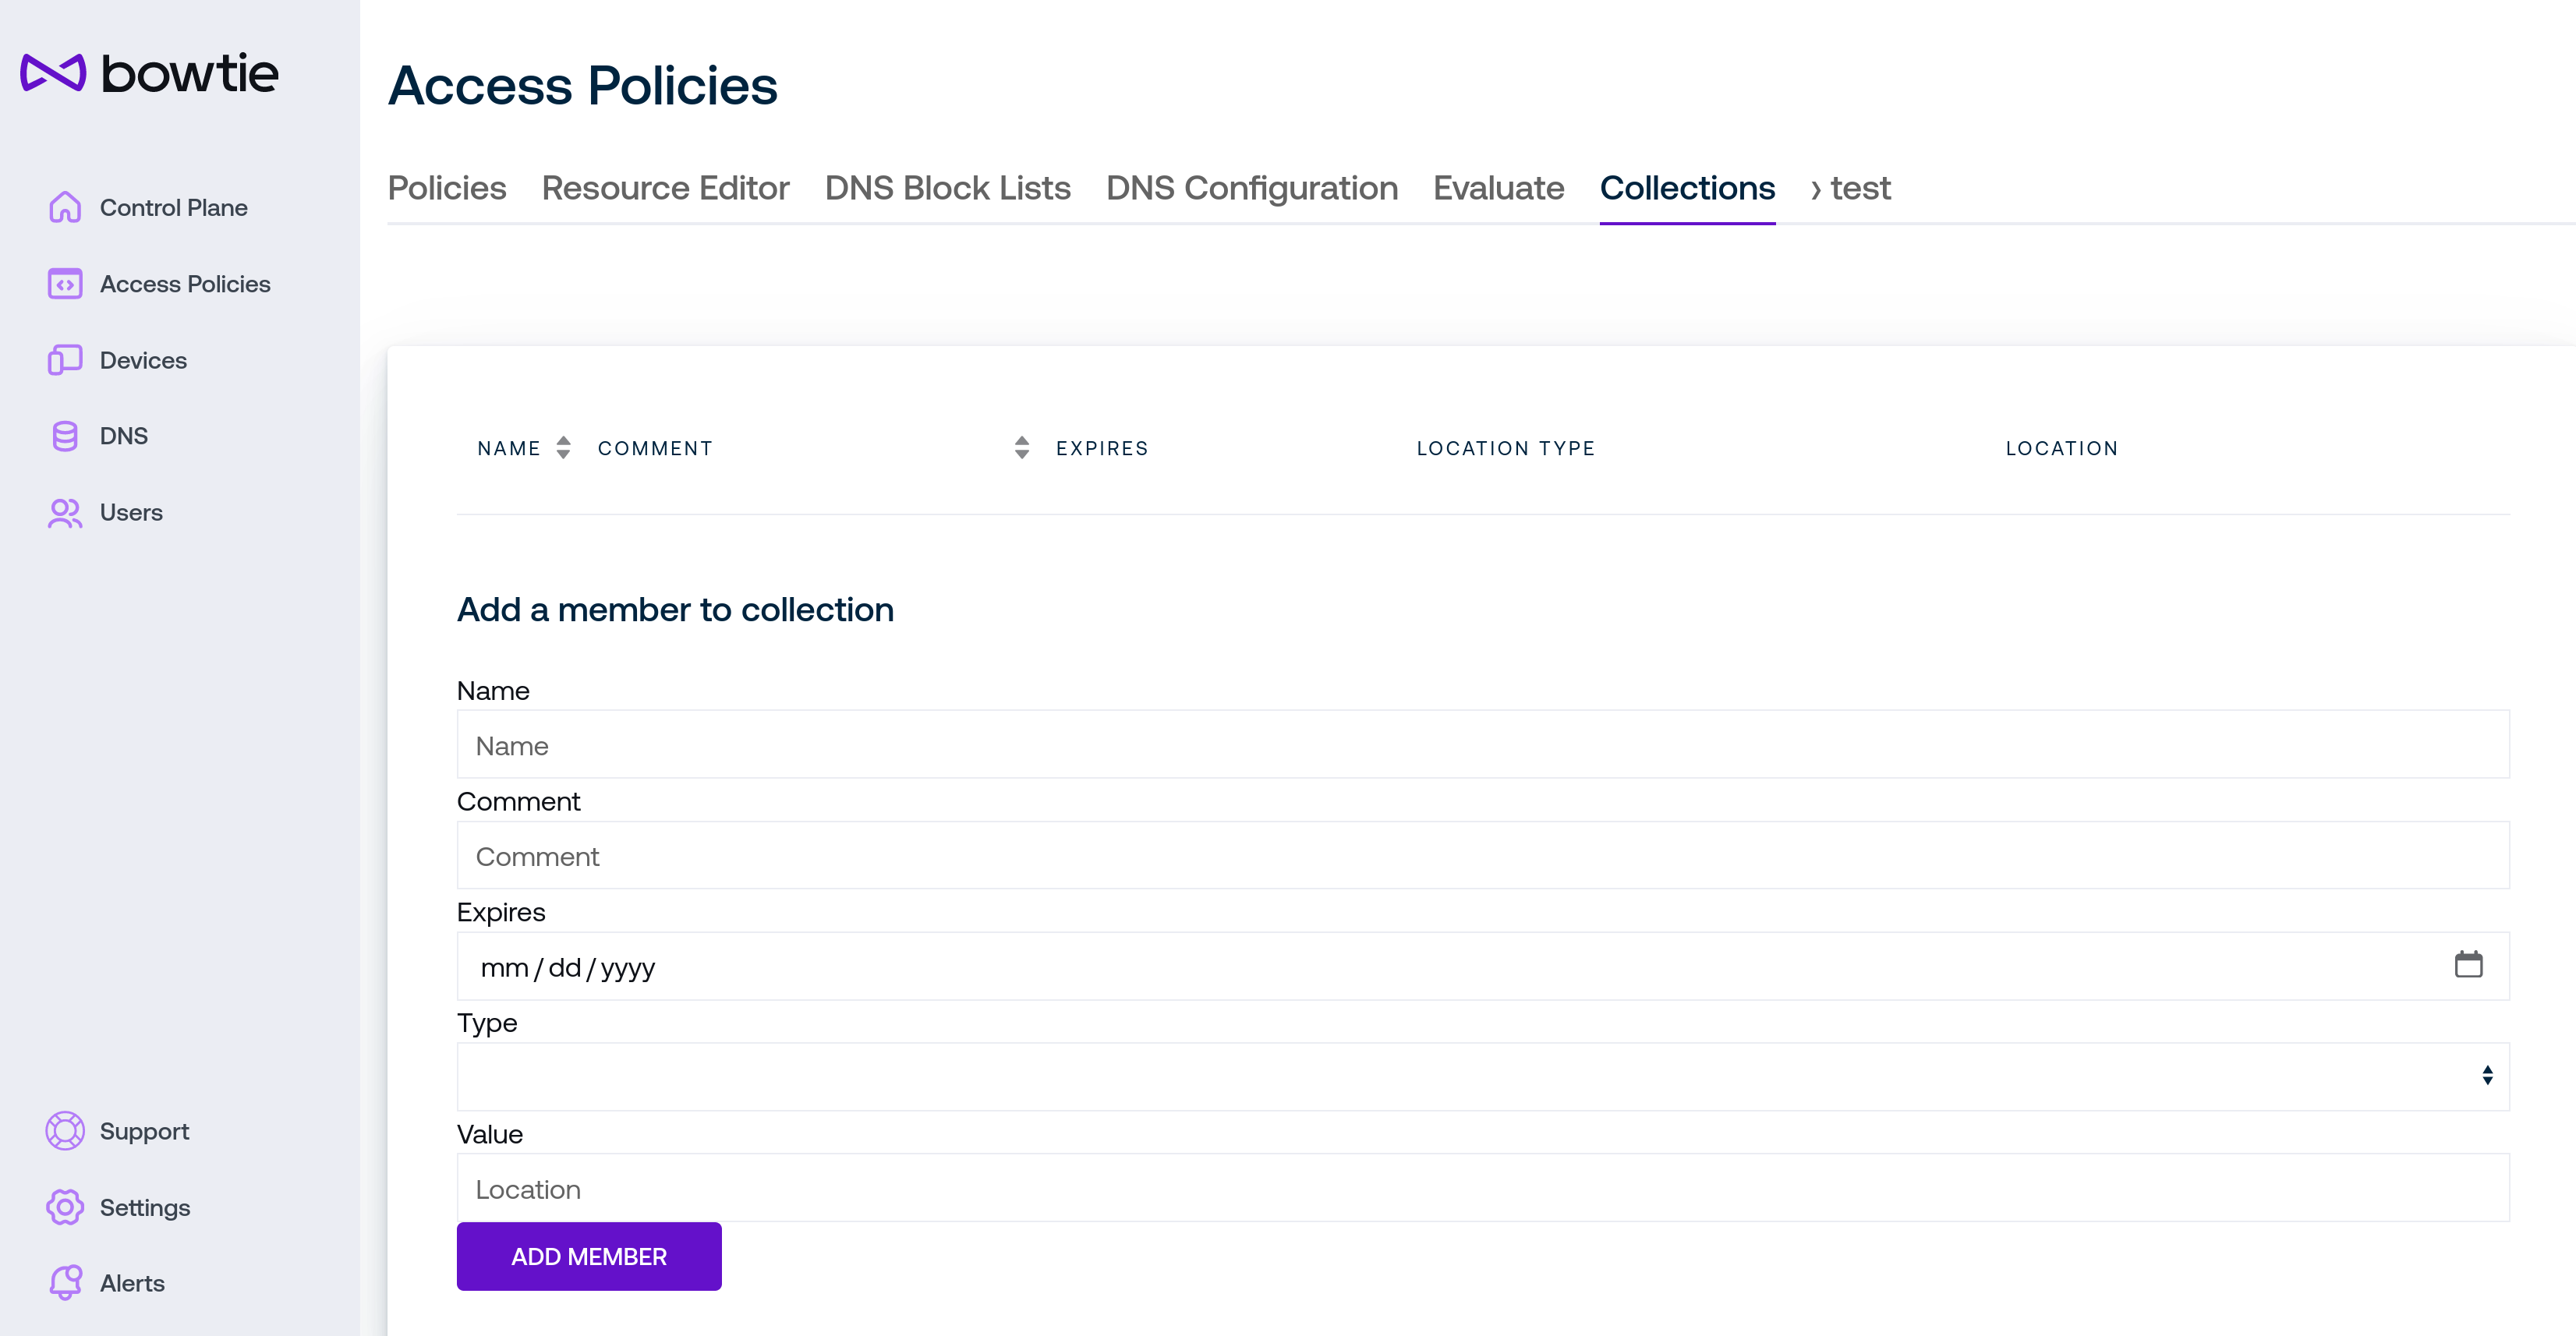
Use the Add a member to collection section to build up individual members of the collection by filling out the fields:
Name is a human-readable name to identify the collection member in the web interface.
Comment is also a free-form text field for administrator use.
Beta Expires may be used in future updates to manage when a collection member is automatically removed.
Type and value are analogous to the values chosen in the Policy Editor.
Click Add Member to add the member to the collection and the trash can icon next to each member to remove them from the collection if desired.
Organization Devices
The Devices link on the left sidebar holds the Devices page:
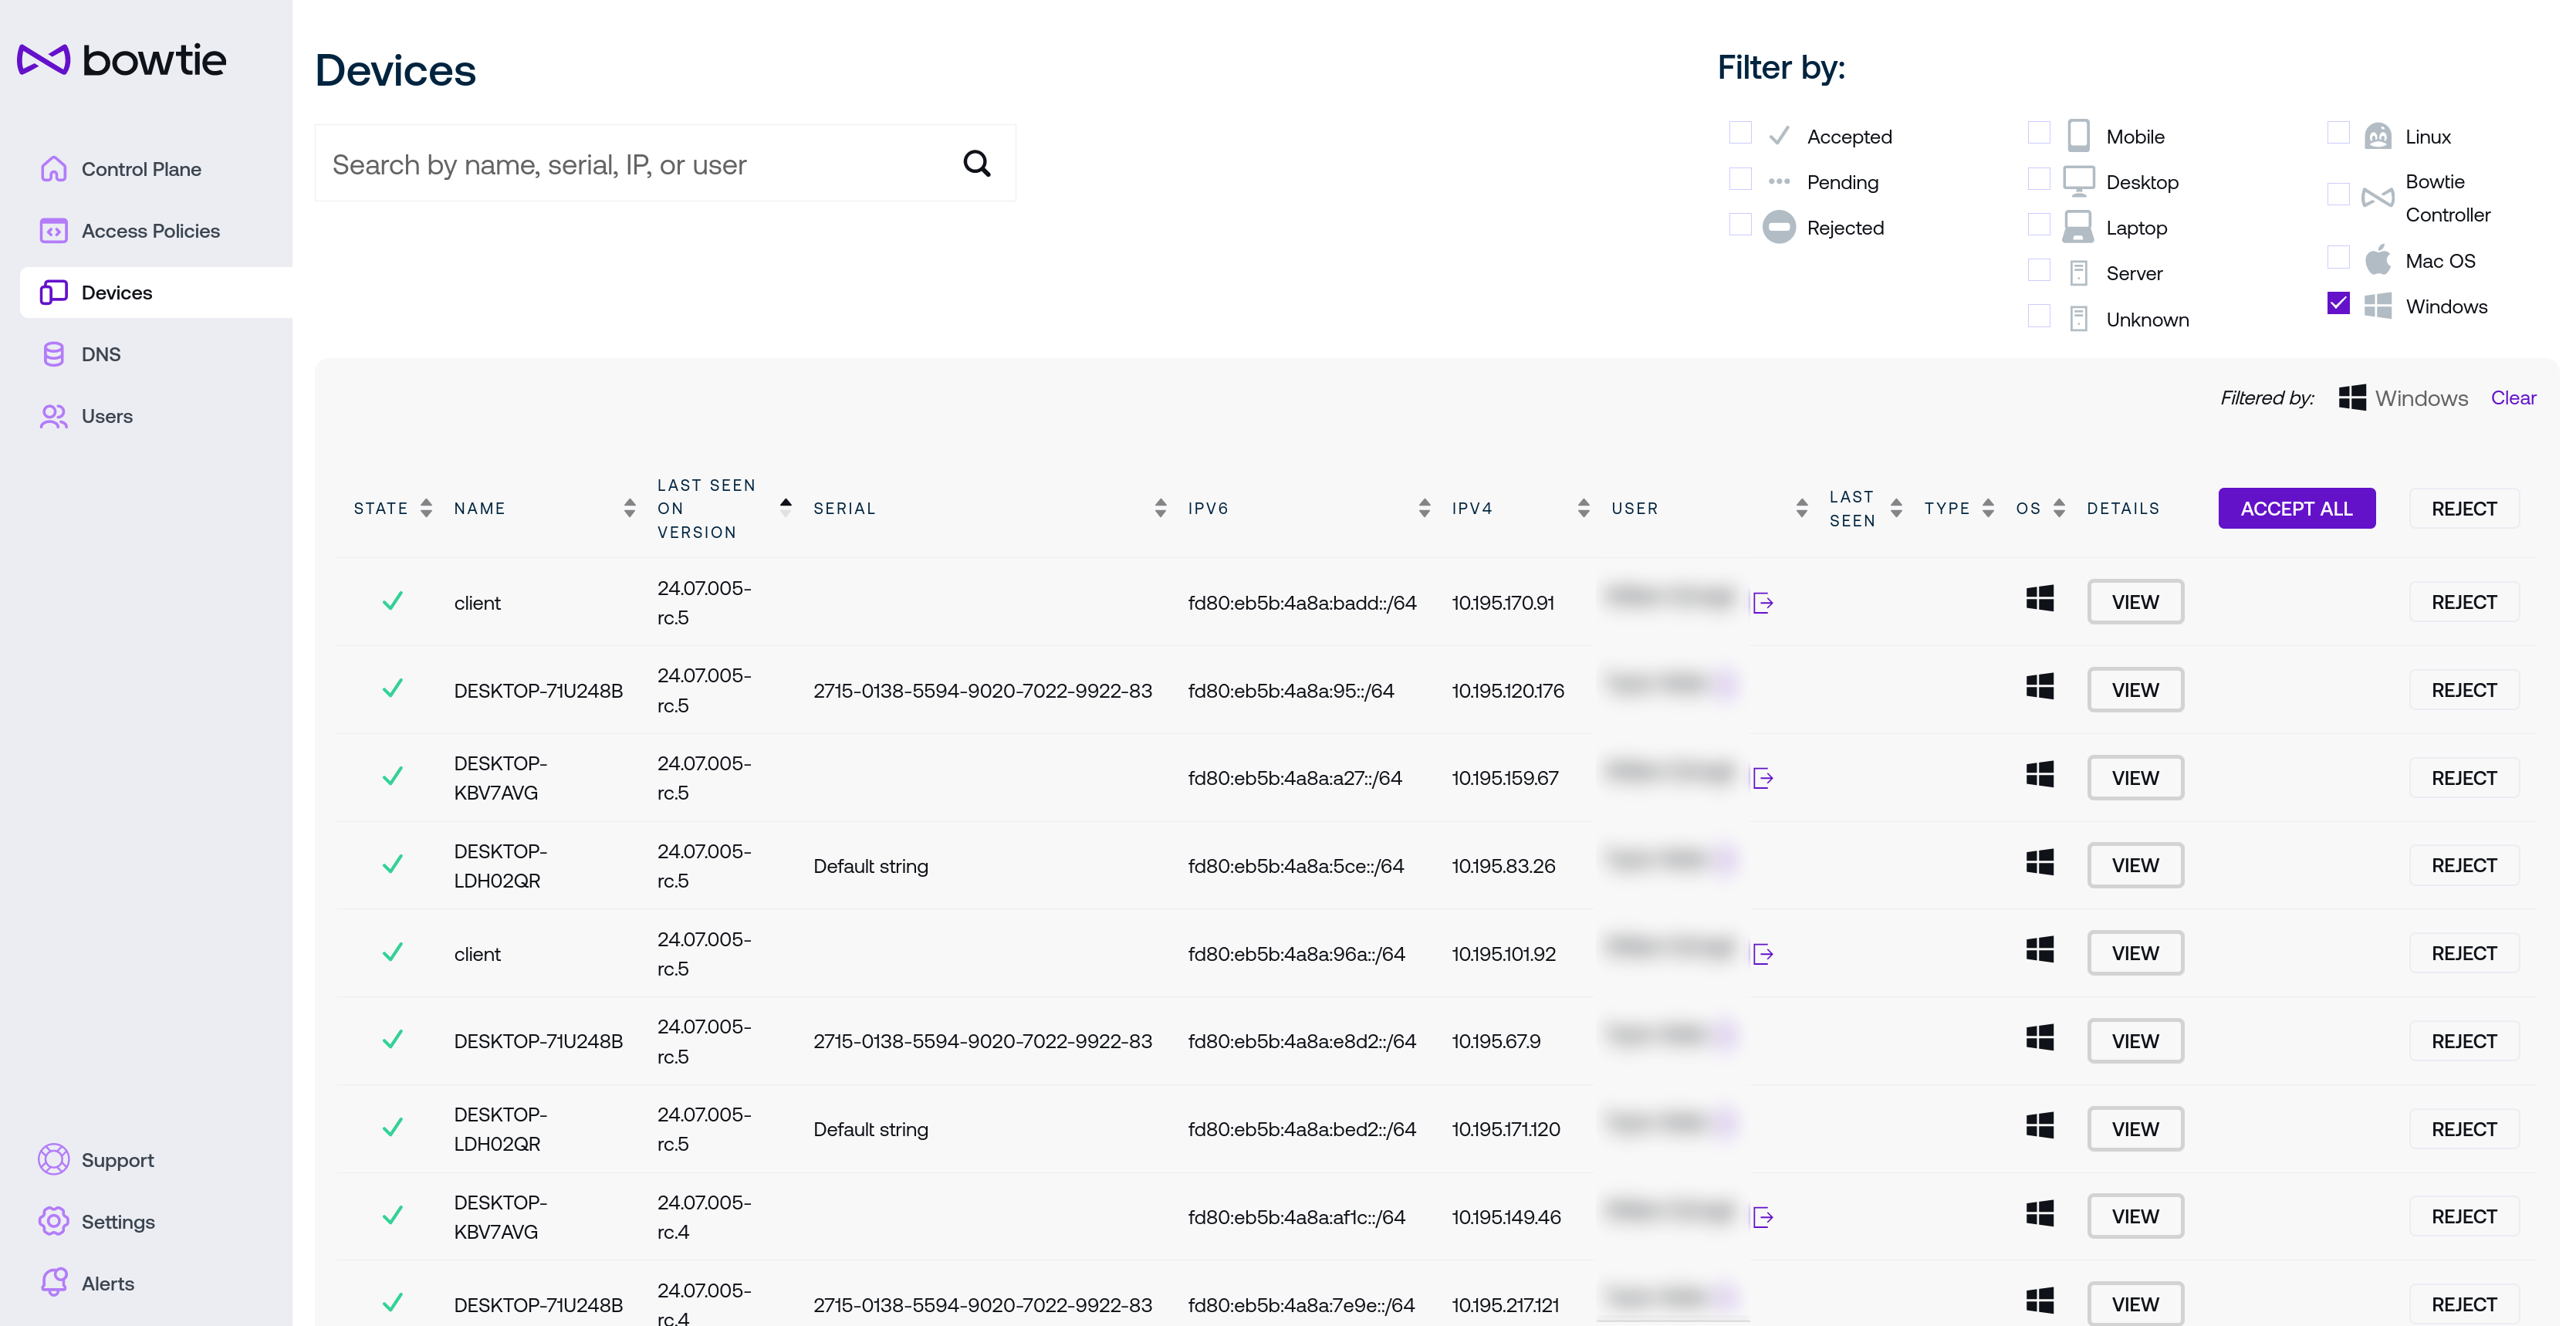
Each device listed on this page represents a connected Bowtie Client. In addition to identifying data such as state, name, version, serial identifier, network addresses, associated user, and last seen date, the final column provides controls to grant or deny a given Client membership on the private Bowtie network. State determines whether a Client will be offered a routable connection to the sites that this Controller provides access to.
Devices in the Pending state have initiated a membership request but have not yet been either Approved or Rejected.
Approved devices are trusted by the Controller and allocated an address capable of traversing sites served by this Controller.
Rejected devices are not granted access and will not receive any address from the Controller.
Two controls are provided at the top of the Devices table to either accept or reject all devices for convenience.
The User column will associate Users to their respective devices once end users authenticate to the control plane. The Bowtie client will automatically open an authentication page on installation asking users to login to the control plane via any Single Sign-On providers that you have configured on the Controller. Click on the icon next to a user’s name to force-terminate that user’s logged-in session.
The View button provides additional information and controls about specific clients.
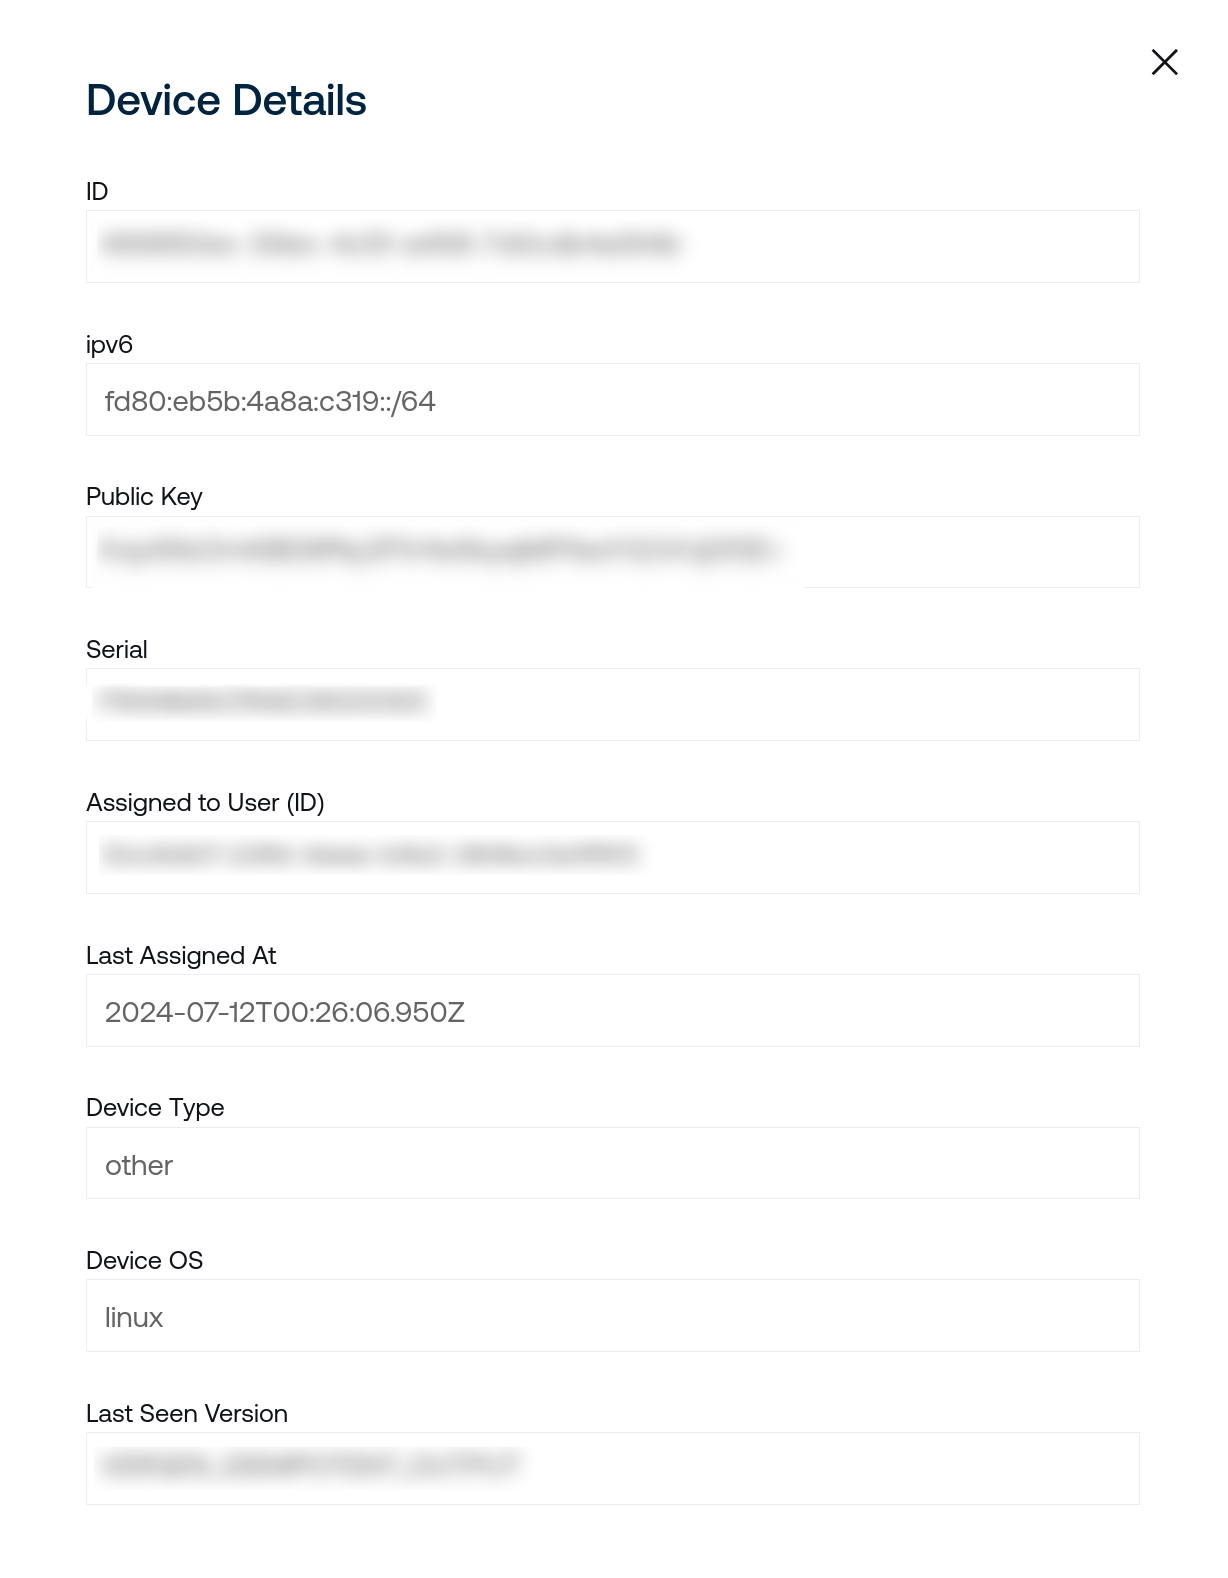
The first section under Device Details lists information gleaned from data provided from connected clients to the control plane. The identifiers on this page refer to their unique IDs that may be re-used for tasks like calling the Controller REST API with specific IDs for resources like devices or users. If clients update their local Bowtie installation, fields like Last Seen Version will update on this page to reflect the client’s current state.
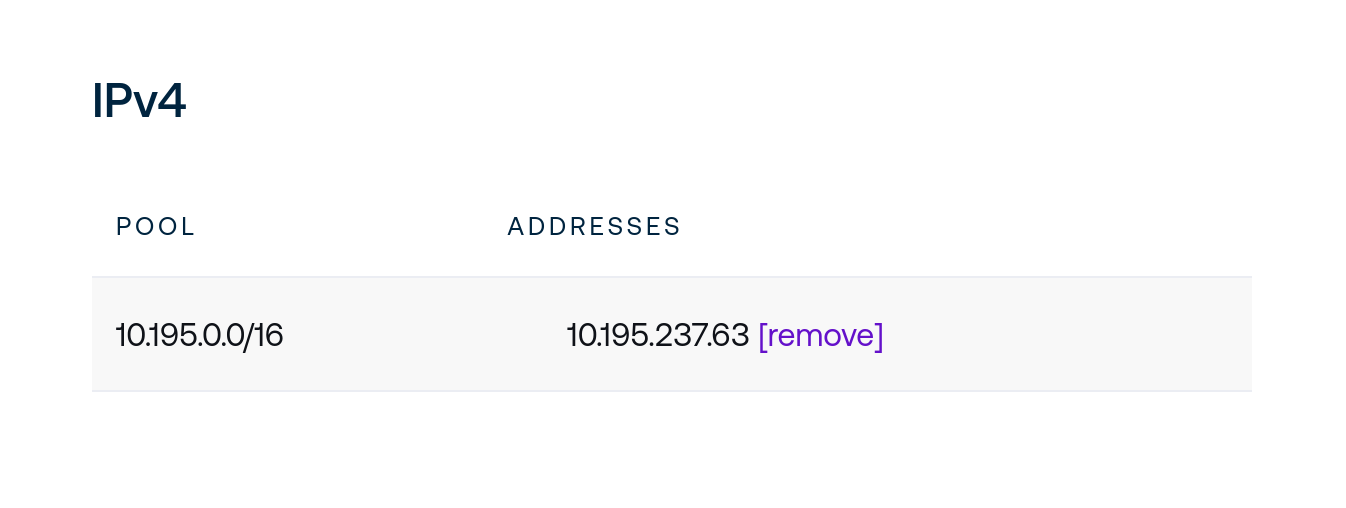
The sections that follow Device Details lists IP addressing information for each client.
Assigned addresses drawn from Address Pools will be displayed on this table. Addressable pools may be configured by administrators.
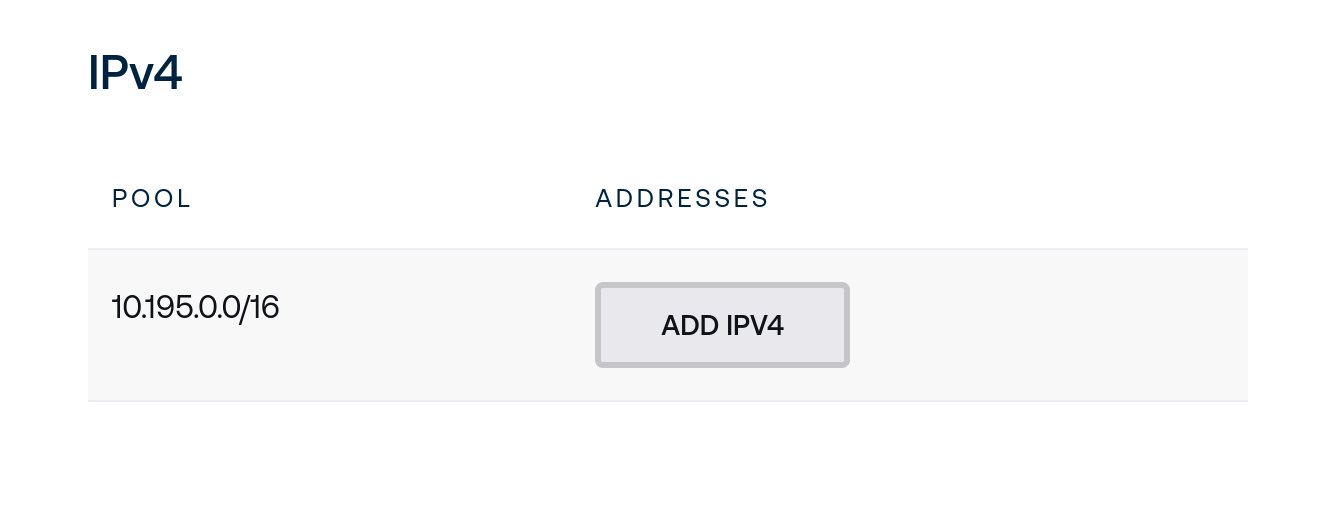
When on-demand addressing is enabled, the following button will be available to allocate addresses on-demand. Click Assign to allocate and assign a new address from the given pool to this client.
Device Pre-approval
Rather than waiting for new devices to appear and then approving them for membership in the private network as they request it, you may instead preemptively control approval status by defining desired state for specific device serial numbers beforehand. When the device checks in and requests organizational approval, the Controller will consult these authorization decisions and enforce the decision automatically.
For example, consider an organization that has provisioned two laptops for end users with the serial numbers 8e37fc1122fb43649010c6dfc87f43d6 and FRANMACPA428200128.
The Controller web API provides an OpenAPI spec at the URL /-net/api/v0/openapi.json which includes a route for /-net/api/v0/device/auth_decision with the following description:
Authentication Decisions are used to accept or reject devices which have not yet checked in. For example if you want to use MDM to pre-allow purchased computers by serial number before they have been commissioned. This request will upsert any number of approvals or rejections.
The schema for this API route adheres to:
{
  "auth_decisions": [
    {
      "id": "<UUID4 string>",
      "device_id": "<UUID4 string>",
      "serial": "<string>",
      "enforce_state": "retain | accepted | rejected"
    }
  ]
}
To set authentication enforcement decisions for these two devices, first obtain valid authentication tokens to interact with the control plane UI via either API Keys or via the /-net/api/v0/user/login endpoint and capture the resulting Set-Cookie header.
Then send a POST request to your Controller’s web endpoint with a payload similar to the following.
The id and device_id fields should be arbitrary UUID4 strings per-device.
{
  "auth_decisions": [
    {
      "id": "e25aea1f-c283-4b43-9984-e836e3a673c9",
      "device_id": "e25aea1f-c283-4b43-9984-e836e3a673c9",
      "serial": "8e37fc1122fb43649010c6dfc87f43d6",
      "enforce_state": "accepted"
    },
    {
      "id": "2fdcfc0a-2d4b-4932-a599-9213a2f33f36",
      "device_id": "2fdcfc0a-2d4b-4932-a599-9213a2f33f36",
      "serial": "FRANMACPA428200128",
      "enforce_state": "accepted"
    }
  ]
}
For example, to send this JSON document stored in a file device-approvals.json to the Controller endpoint https://example.com/-net/api/v0/device/auth_decision with a previously-generated API token stored in the shell variable $token with the key ID stored in the shell variable $key_id:
curl https://example.com/-net/api/v0/device/auth_decision \
  --user $key_id:$token \
  -H 'Content-Type: application/json' \
  -X POST \
  --data-binary "@device-approvals.json"
DNS
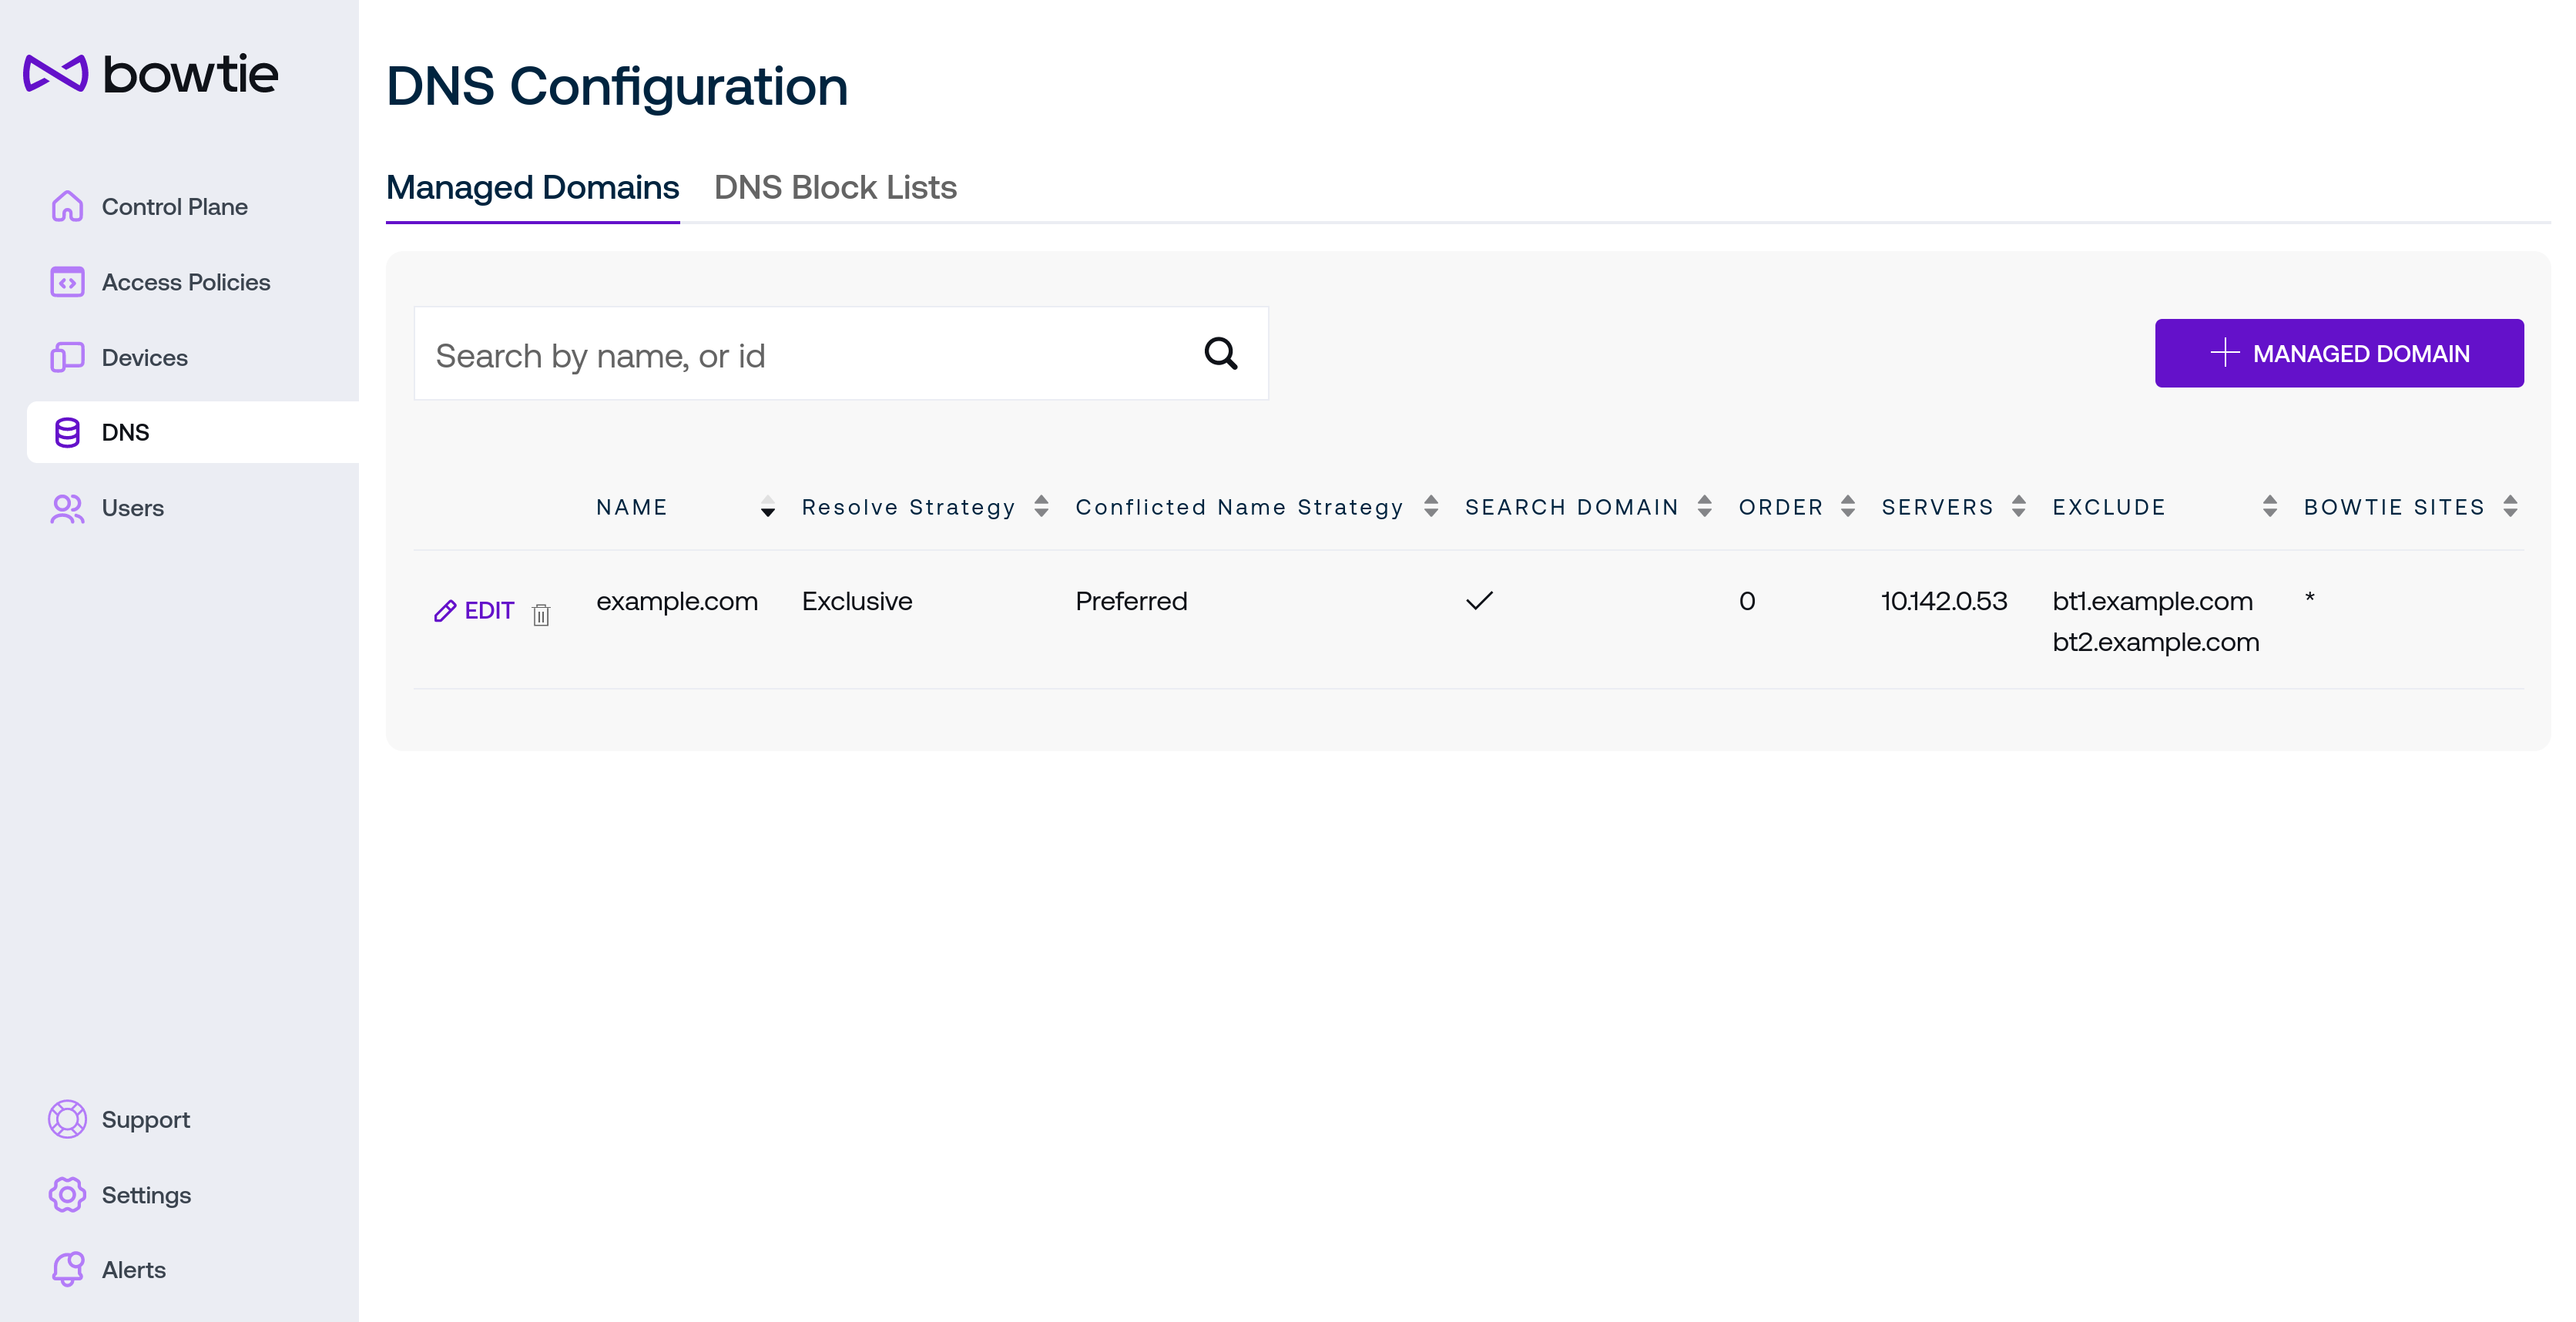
DNS settings let approved clients resolve private names drawn from the DNS servers listed on this page. Controllers can accept any listed DNS server as long as the destination DNS server is reachable from the Controller’s network.
To add a new managed domain, click + Managed Domain to enter the desired settings into the new modal dialog:
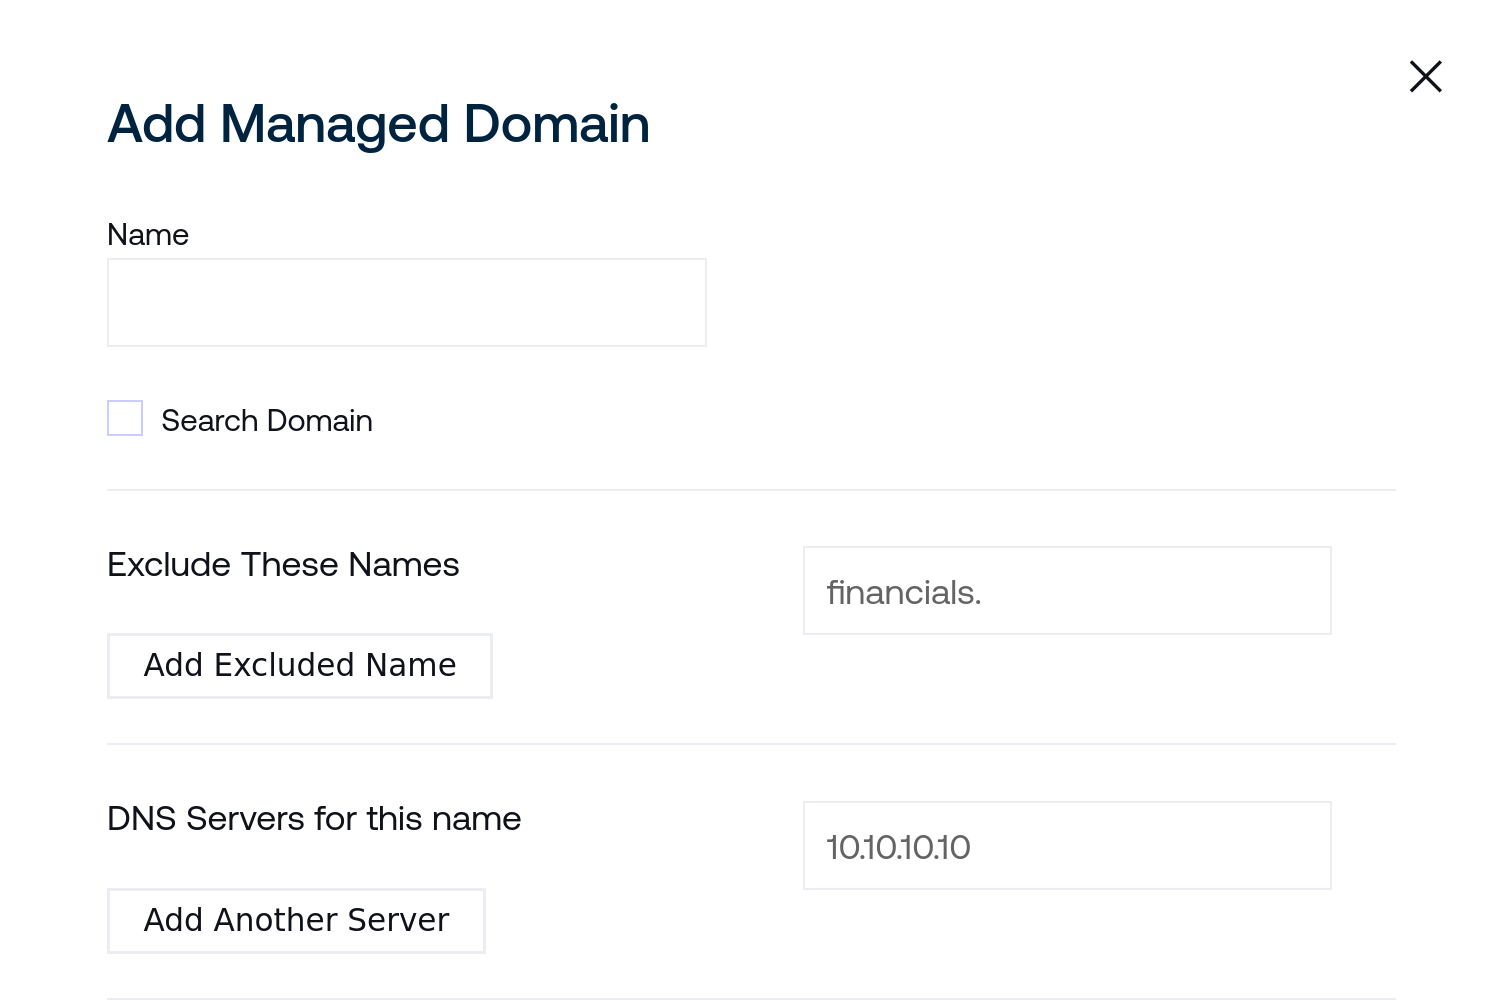
Name should match the desired domain that you would like clients to resolve private DNS for. For example, entering
example.cominto this field will intercept and serve DNS responses for names likepriv.example.comif one of the listed DNS servers for this managed domain returns records forpriv.example.com.Search Domain is reserved for future use by Controllers as a potential feature.
Excluded names will not be sent to the indicated DNS servers. This can be useful to provide private DNS resolution for a central domain while ensuring that some public endpoints remain accessible outside of the private network connection.
Enter individual names here and click “Add Excluded Name” to create additional excluded names.
Under DNS Servers for this name, enter the IP address for each DNS server that should serve responses for the domain identified by the Name for this managed domain. Click Add Another Server to add more than one potential DNS server for the domain.
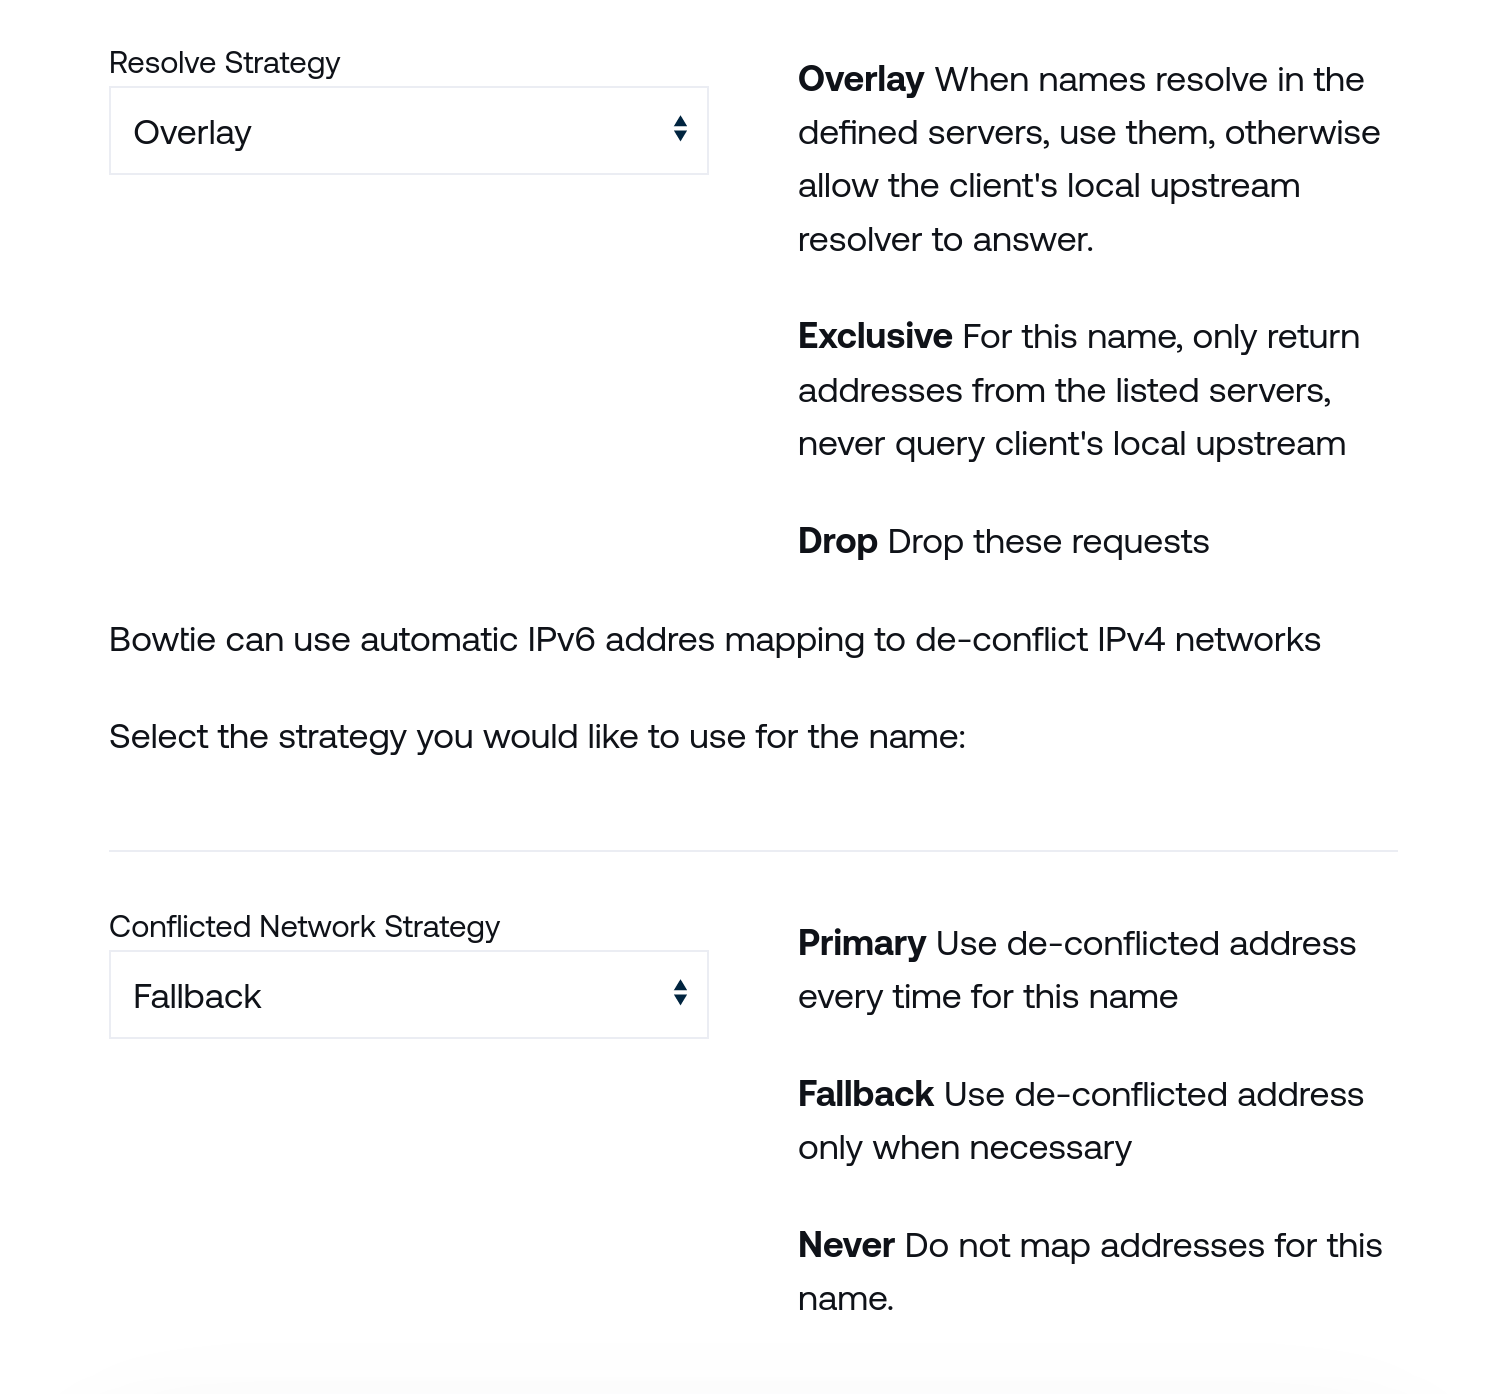
The Resolve Strategy section offers the ability to customize how DNS requests and responses are handled with finer granularity. Choose the strategy that best fits your needs for the chosen Name that you are configuring based upon the descriptions on this page for each strategy type.
The Conflicted Network Strategy section controls how resolution should occur in cases where clients may request names that resolve to addresses that conflict with their current network routes. The Fallback default is appropriate for most users, which invokes this behavior only when necessary, but the other options are available for environments that require more fine-grained control.
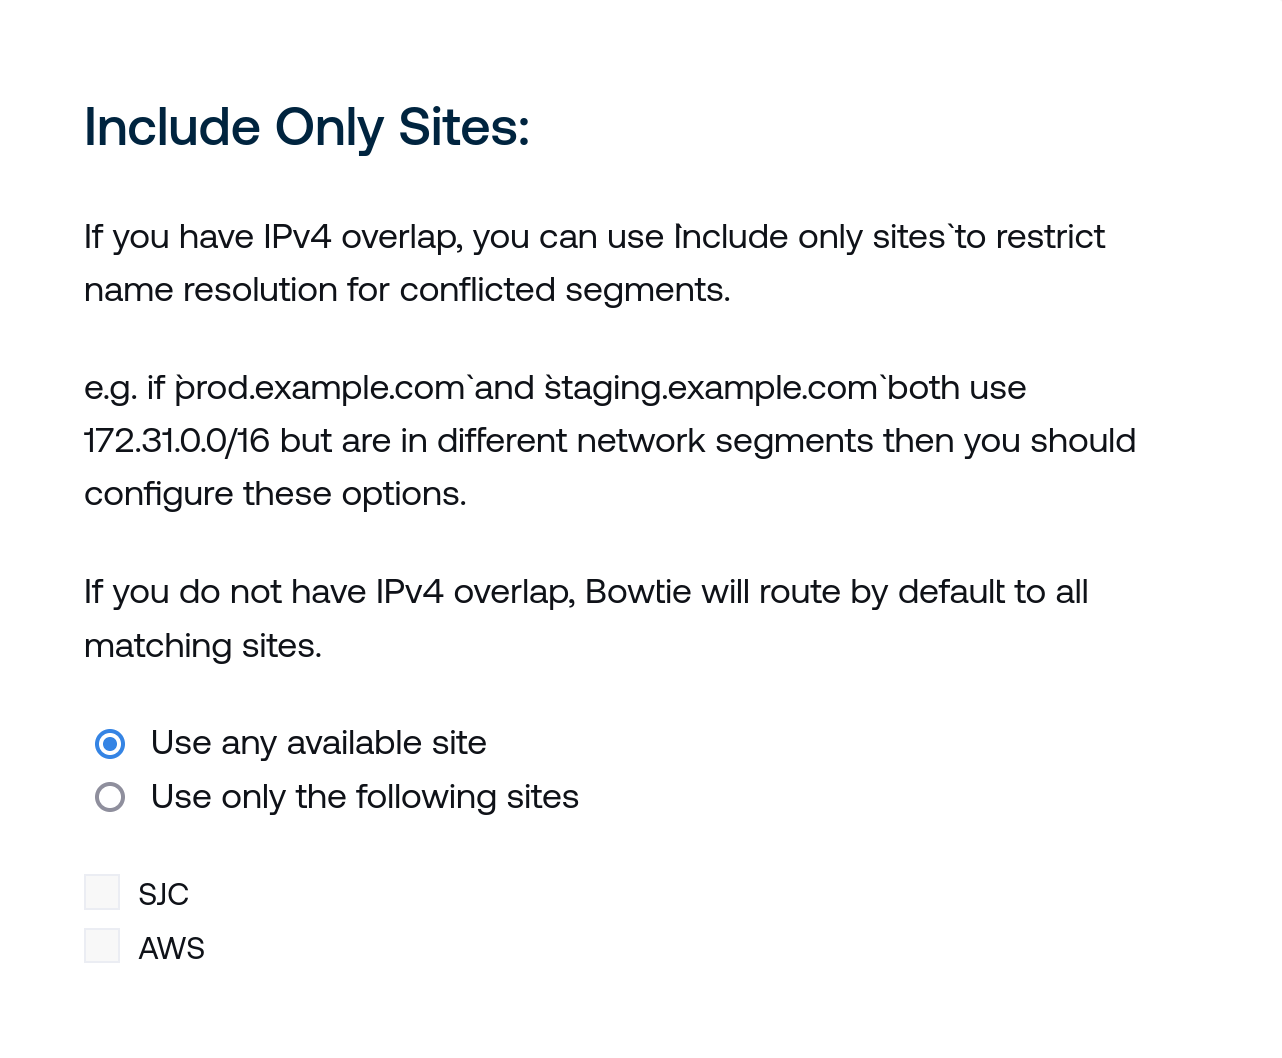
Include Only Sites grants the ability to selectively choose specific sites to resolve when network overlaps may be present. Use the radio buttons and check boxes here to either use any available site, or instead use only specific sites for this domain by choosing the appropriate radio button and then selecting the sites that you would prefer to use for resolution.
Select Save Managed DNS Config to continue. The new domain should begin resolving for connected clients after a short period to synchronize data across connected devices.
Select the Edit button to change any of the aforementioned settings and the trash icon next to the domain name to remove the managed domain. The DNS Block Lists button will navigate to the DNS Block Lists page.
Users
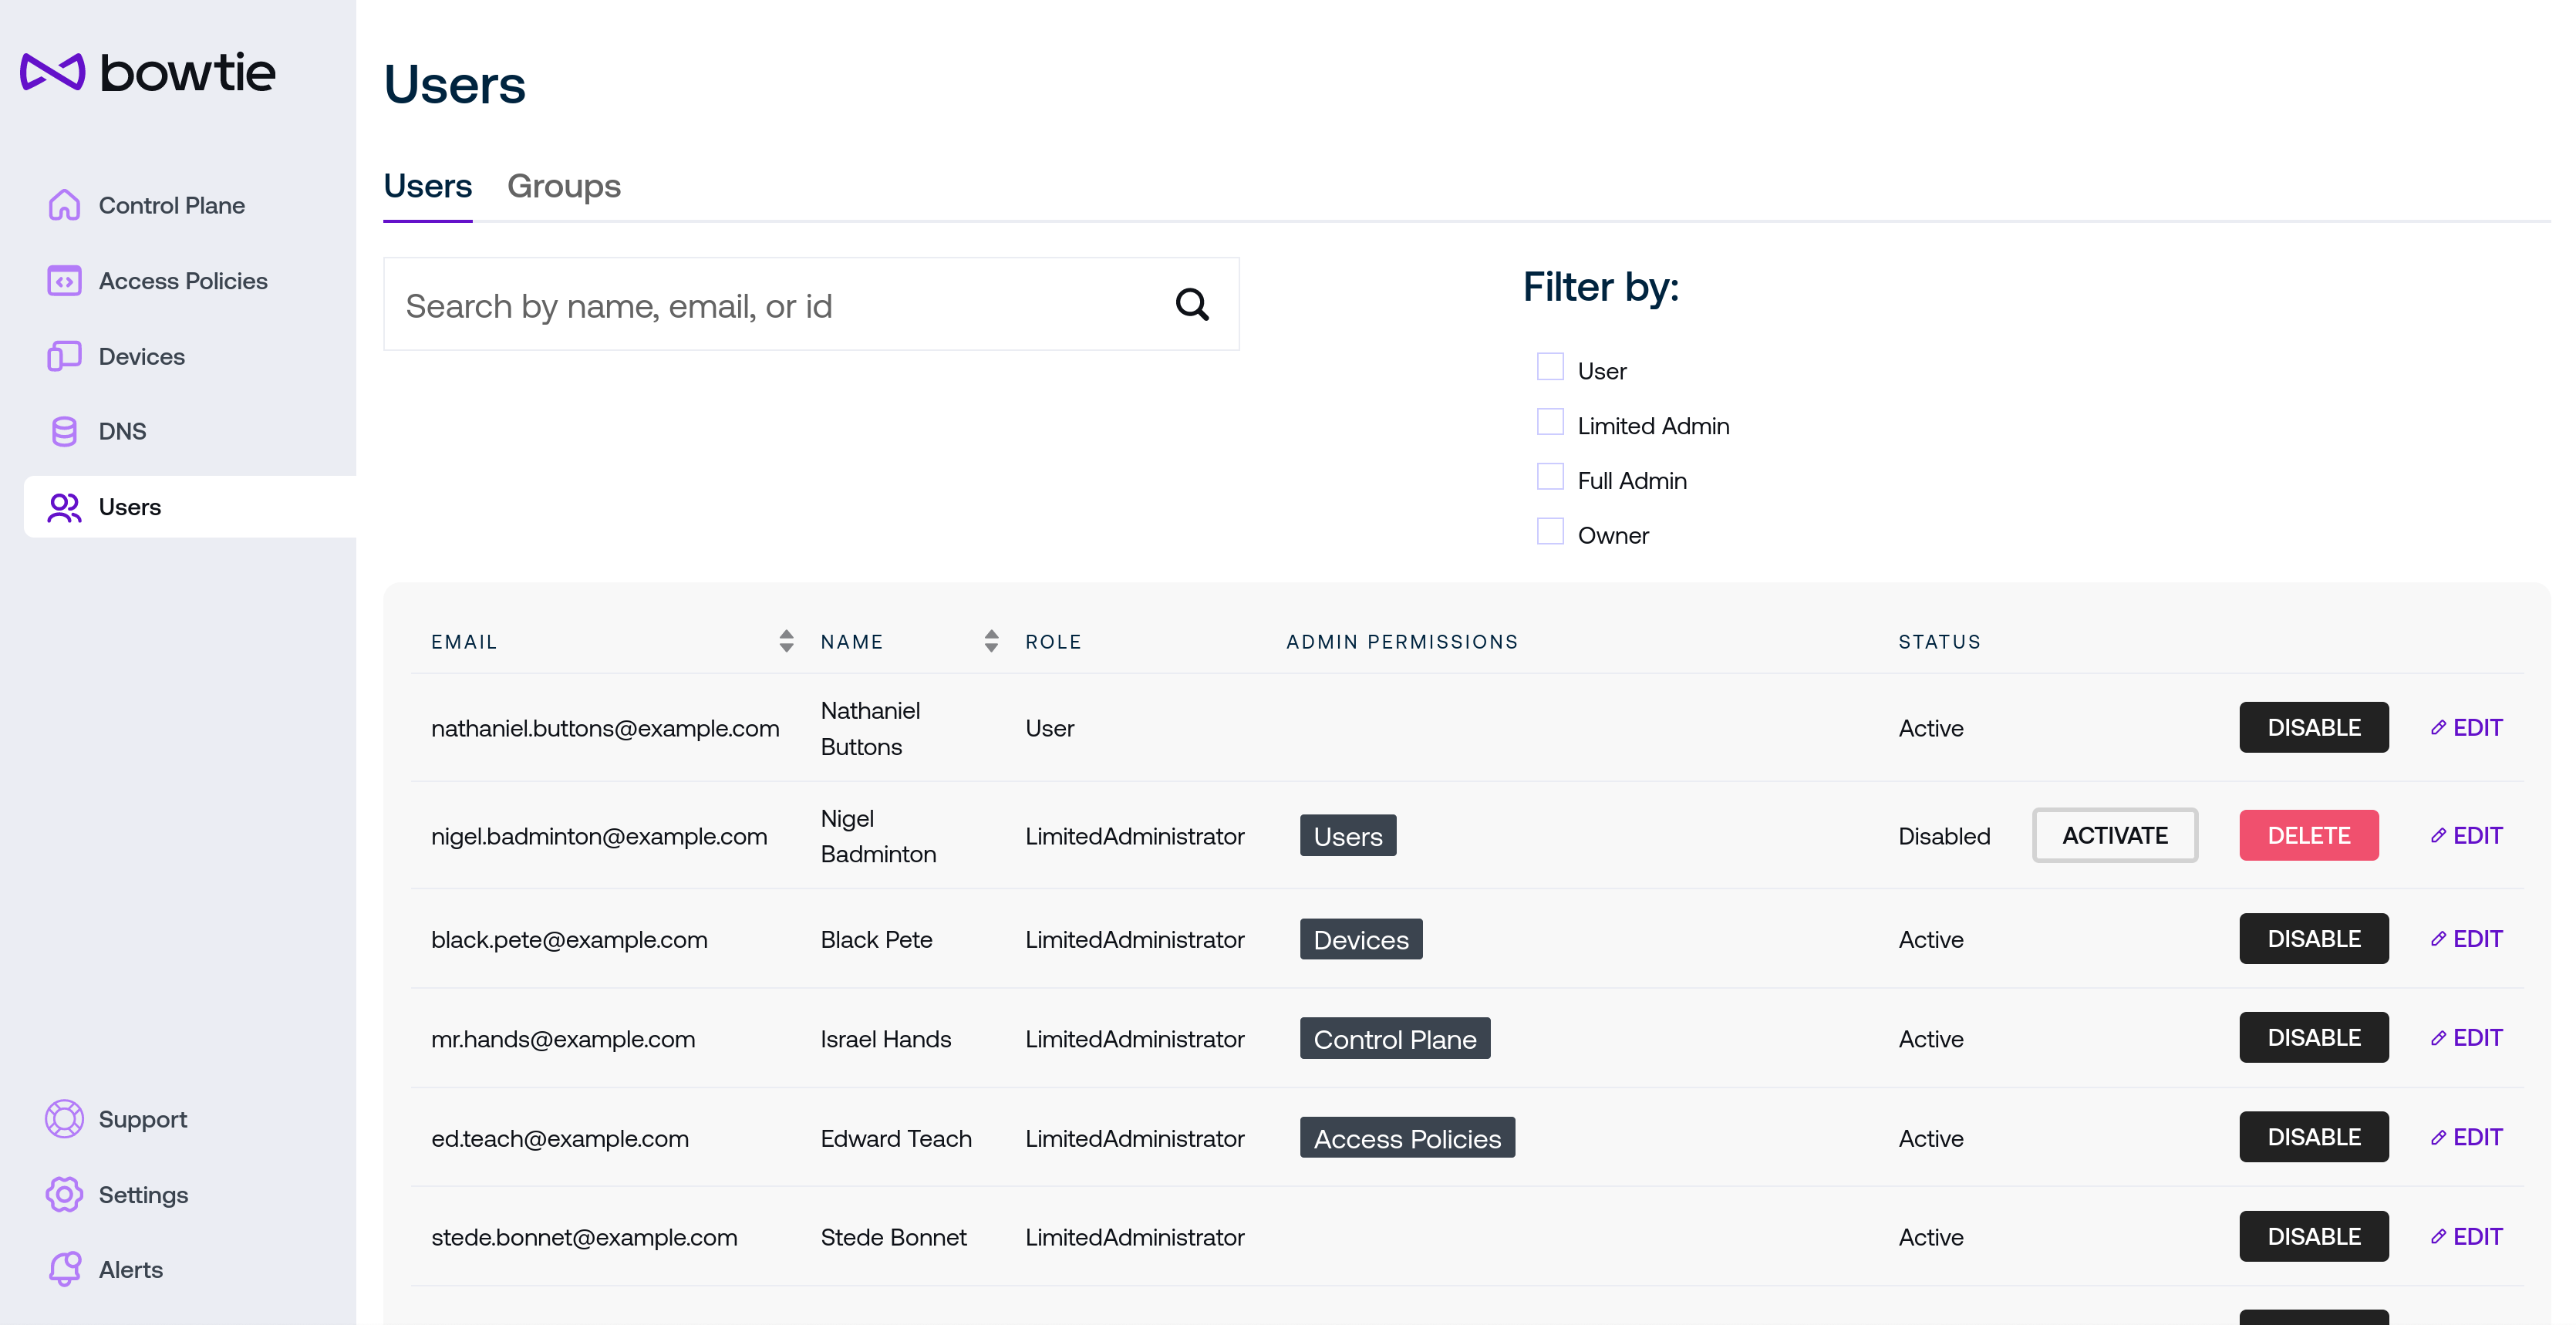
The Users page lets administrators manage user properties like roles, groups, and other information. Users may be added manually using the Add User button at the bottom of the page, but users will also appear after logging in for the first time through single sign-on identity providers.
User Auditing
If your organization needs to monitor user activity like authentication successes or failures, refer to Logs and specifically Application Logs.
In addition to a search box to narrow down users and optional filters, the Add User button or the Edit button at the right of each user’s name in the table presents the following fields:
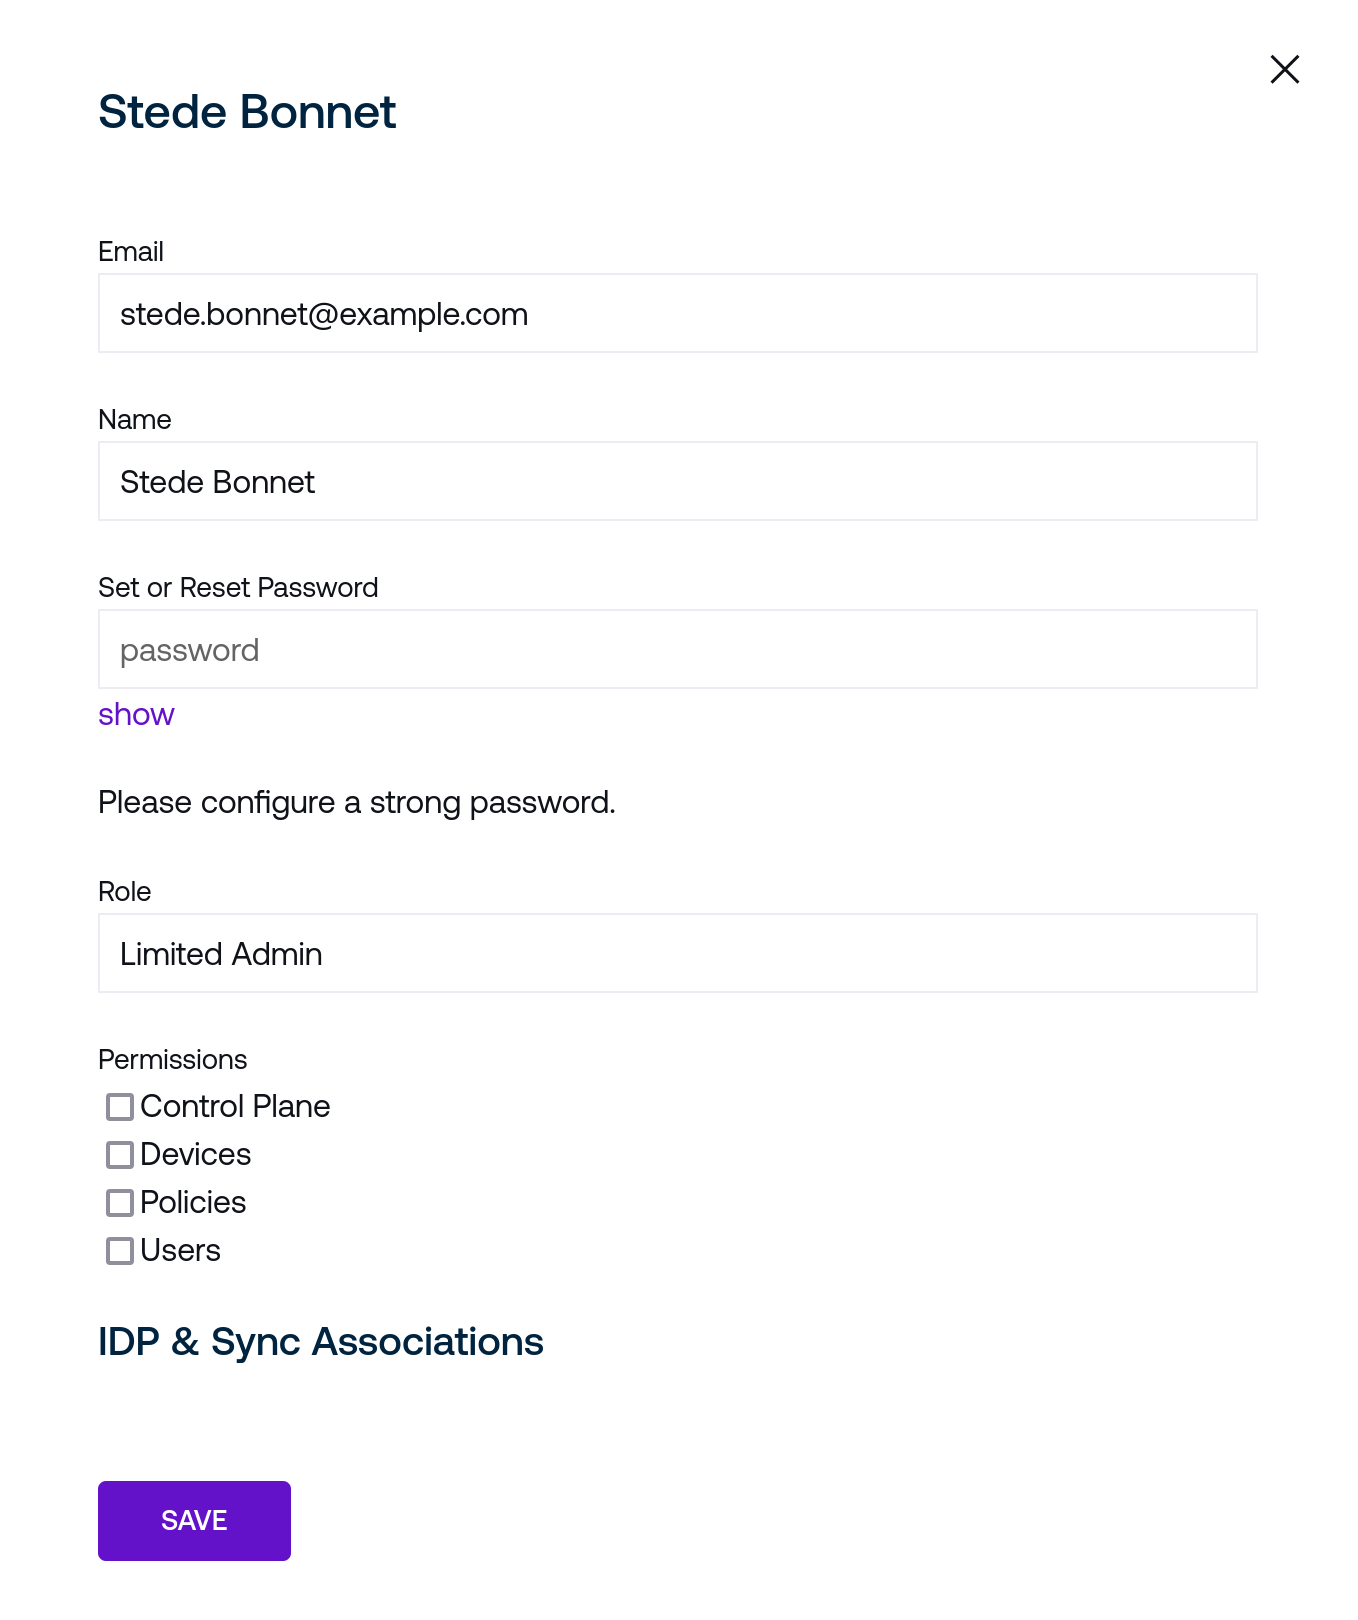
Email should uniquely identify the user based upon an address that also maps to their identity through any configured single sign-on providers.
Name is the user’s given name.
Set Password can optionally set a password that may be used for web-based login independent of single sign-on configurations. Passwords are subject to complexity requirements that are not prescriptive rules against a set of characters but rather checked for overall strength.
In general, choose long, hard-to-guess passwords:
Do not only use dictionary words
Do not use simple sequences on a keyboard
Do not use numbers that are similar to dates, like birthdays
Do not append repetitive characters to pad out password length
The UI element beneath the password field will update with suggested changes to meet these strength requirements.
Role is a drop-down menu with set options to control varying levels of access:
Owner and Full Admin permissions have full administrative control of control plane settings on the Controller. Their names are distinct primarily for auditing and reporting.
Limited Admin users can have zero or more administrative permissions attached. For example, a user who should set policy but not accept new devices onto the network may be granted the Limited Admin role but only have the Policies permissions box checked.
User permissions are meant for everyday users that connect to the control plane without a need to configure control plane settings.
Permissions should be optionally enabled on a per-user basis for users with fine-grained roles like Limited Admin. Each check box correlates with its related administrative page (the Control Plane, Devices, Policies, and Users page, respectively).
Device Permissions
The devices permission grants implicit read-only access to user information to ensure that device ownership data is complete. The devices permission does not grant implicit access to reading user credentials or changing user information.
Save any changes to new or edited users with the Save button.
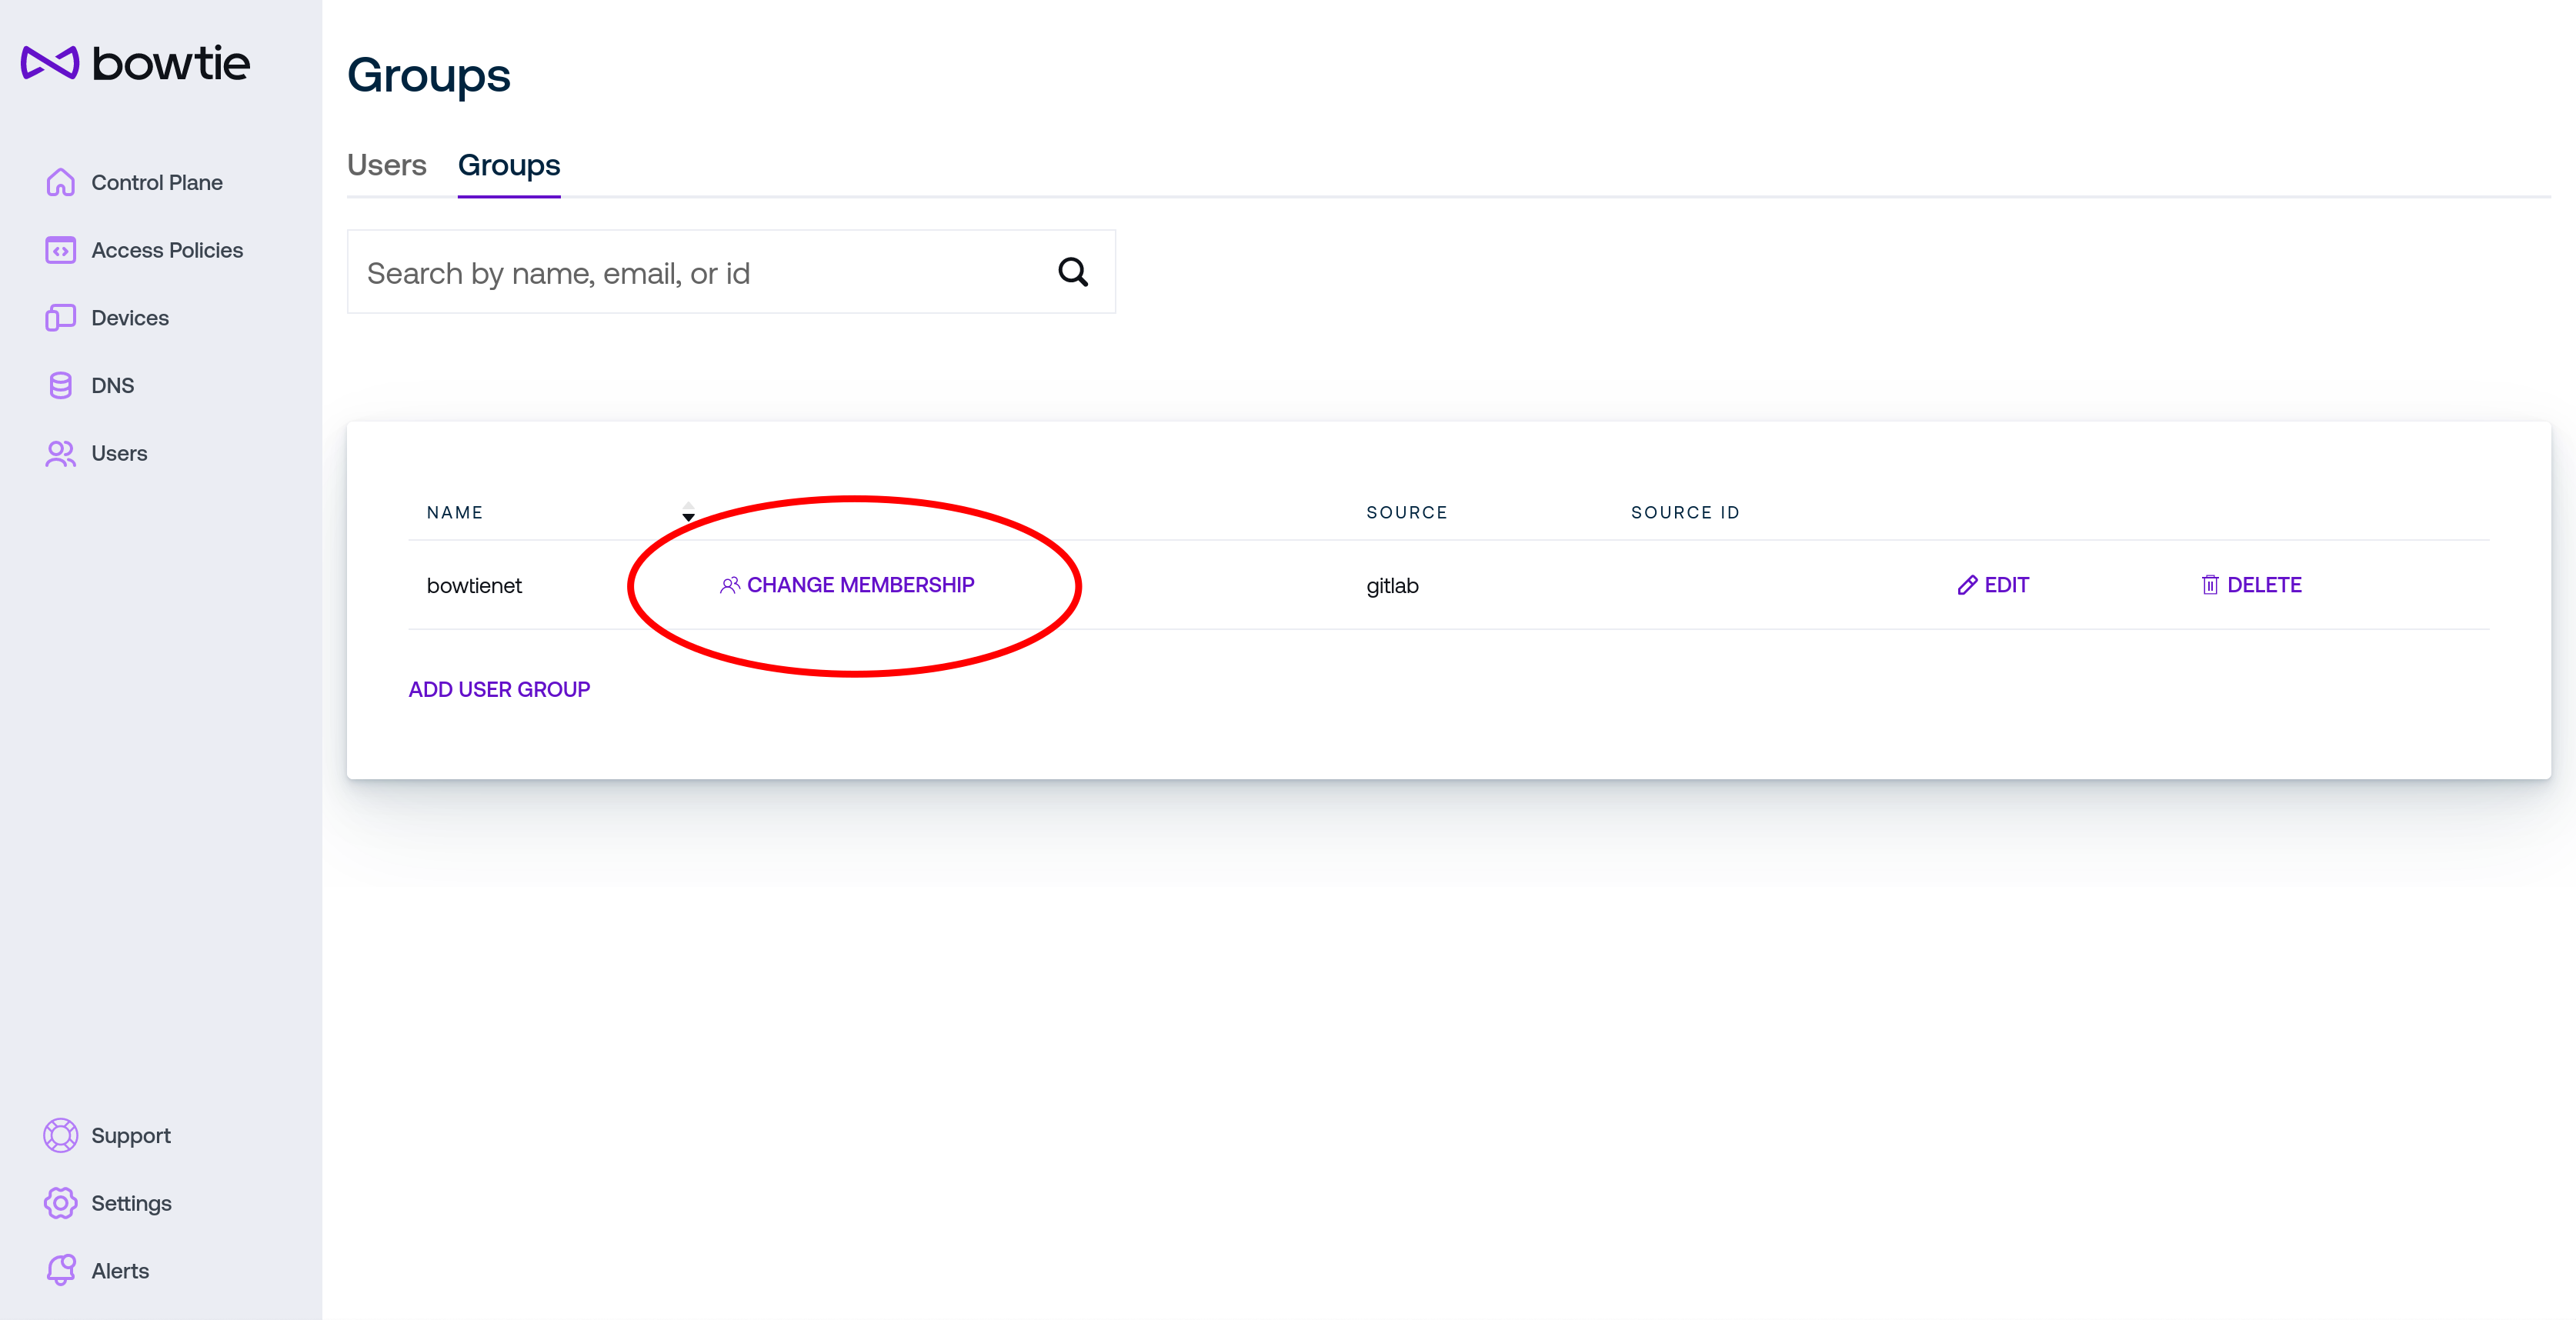
Groups
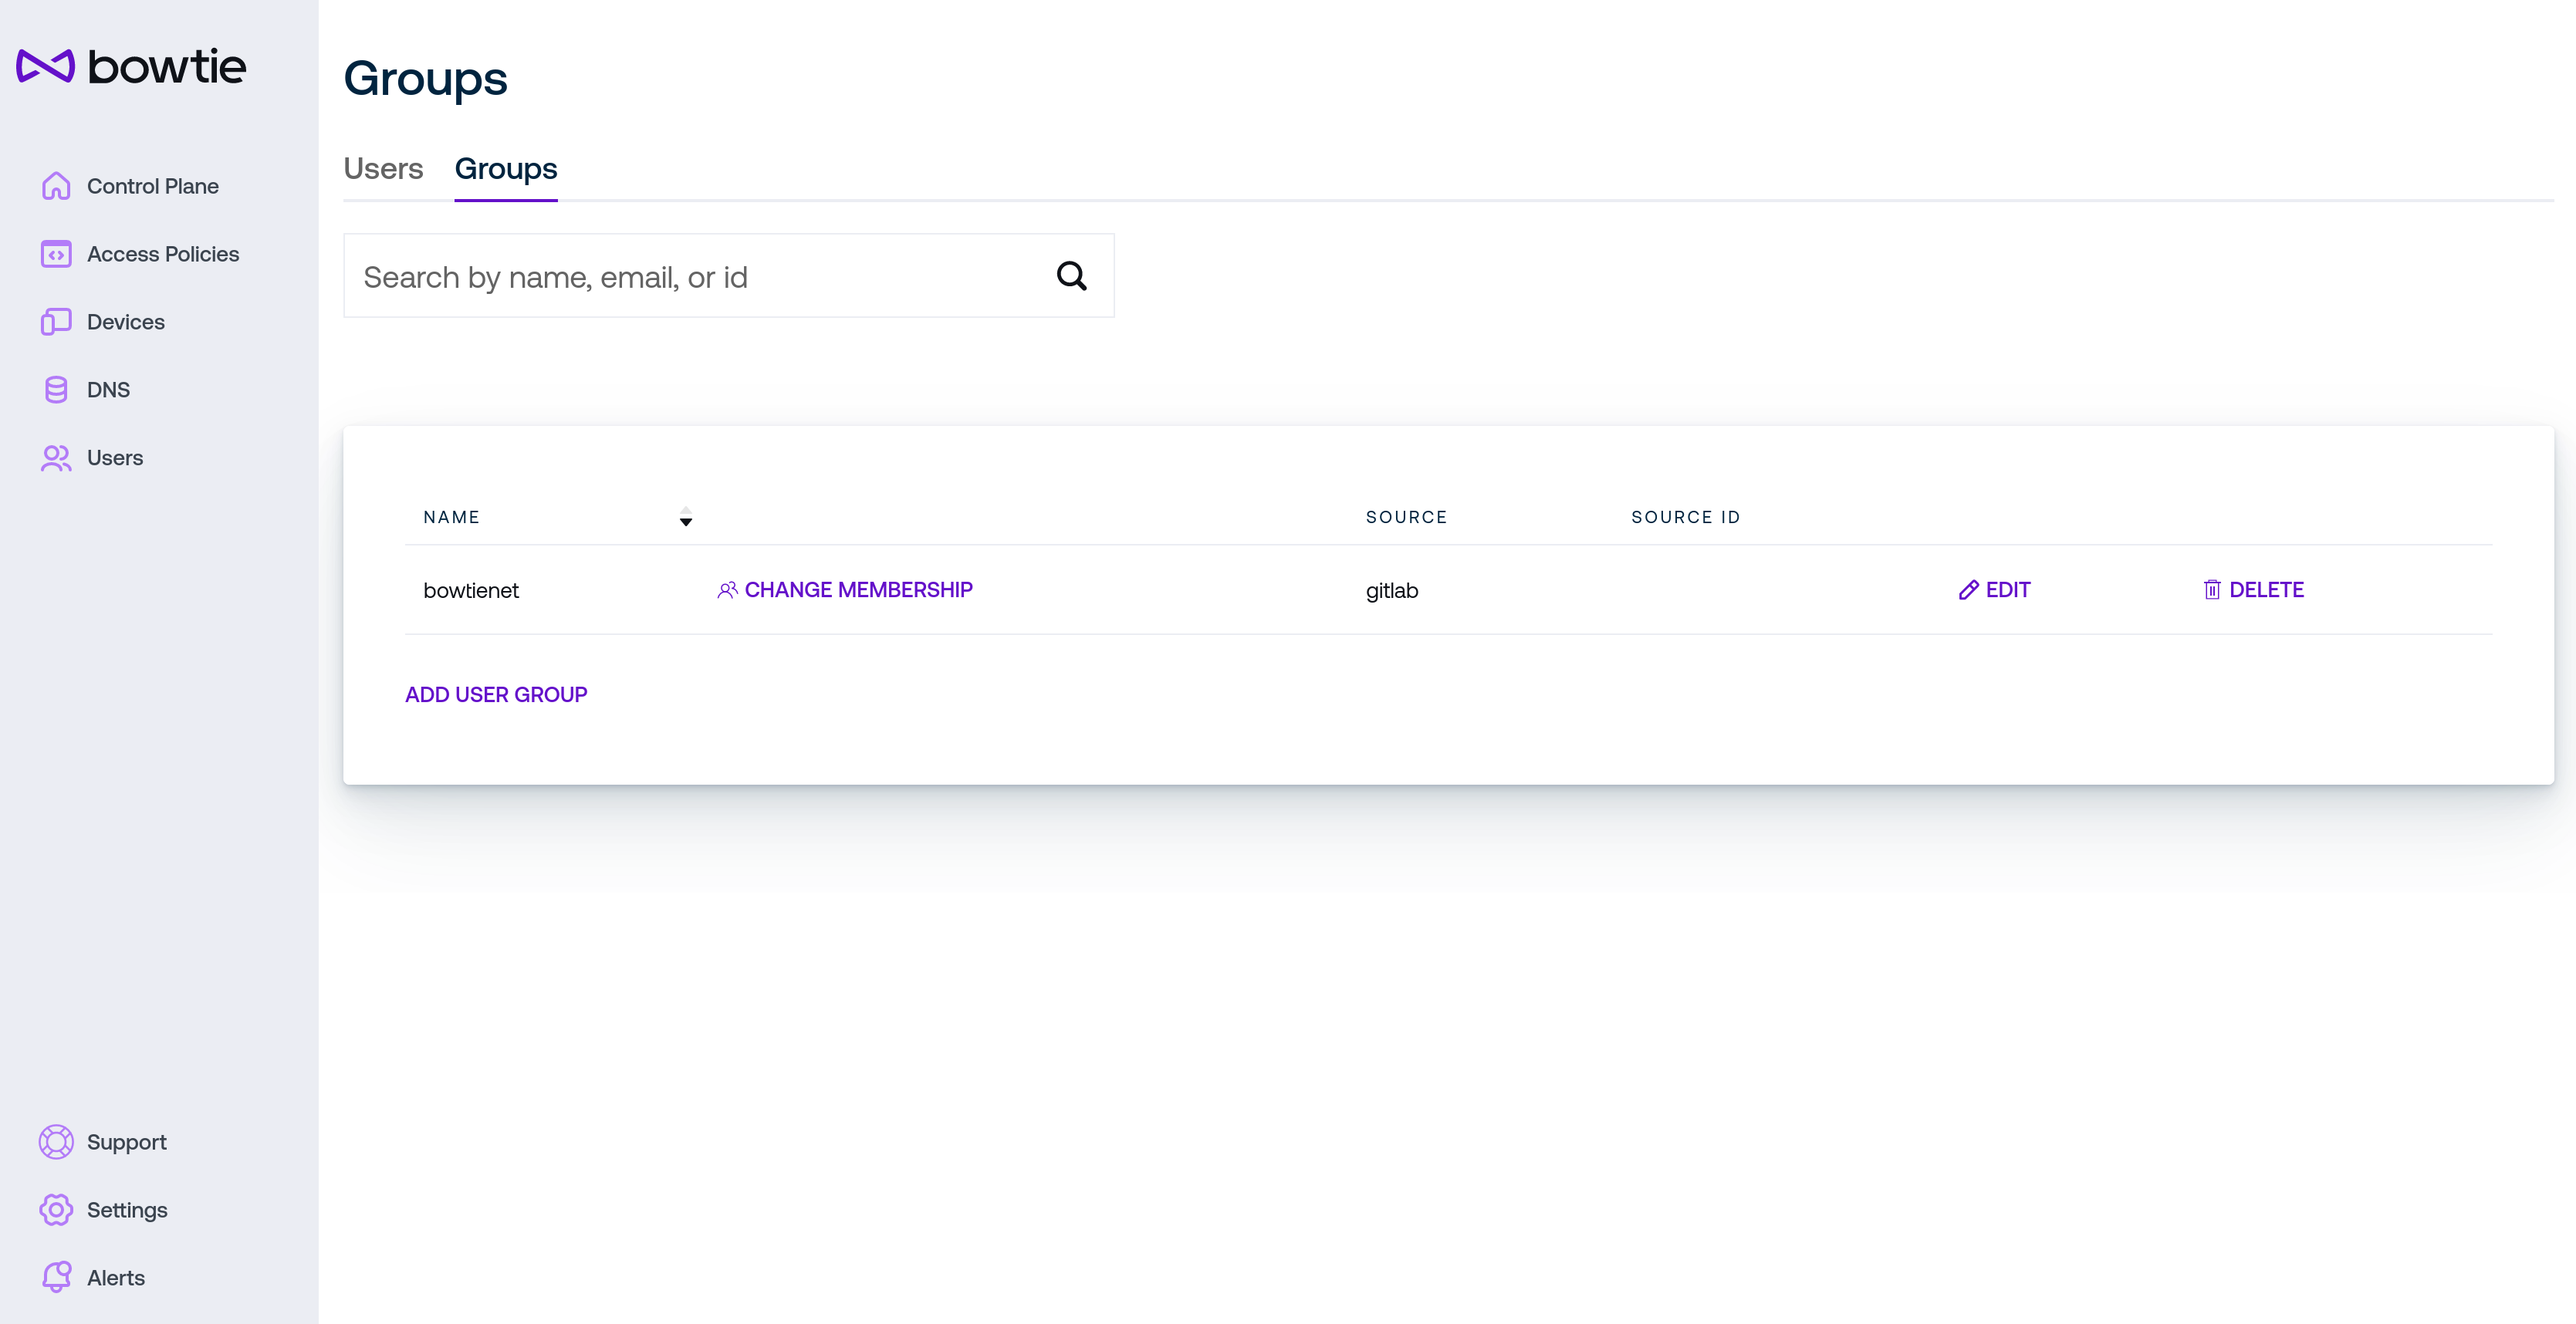
The Groups tab of the Users page lets administrators group users with similar levels of access into logical groups for use in policies. Create groups first, then edit those groups by selecting existing users.
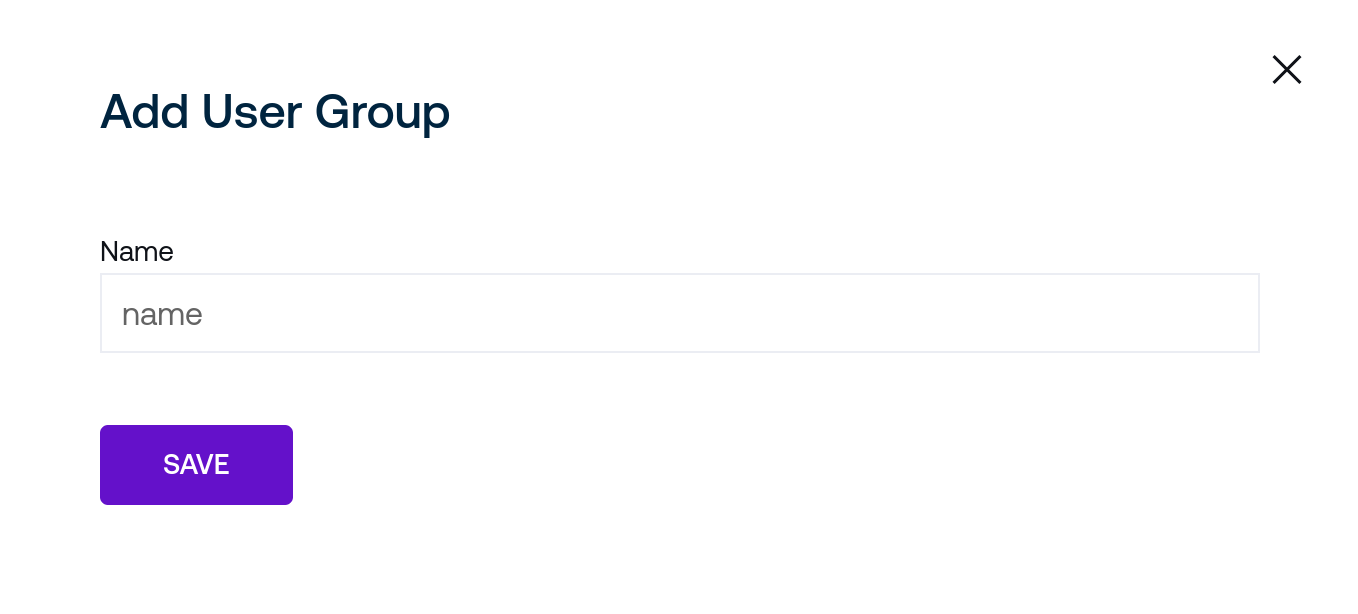
To create a new group, click the Add User Group link at the bottom of the page and fill in the dialog box with a human-readable name for the group and click Save to create the new group.
To edit membership of a group, click the Change Membership link on the group’s row in the table:
From the group’s membership page, select the drop-down menu on the lower left of the screen and select users to add with the Add User button to add any desired members to the group.
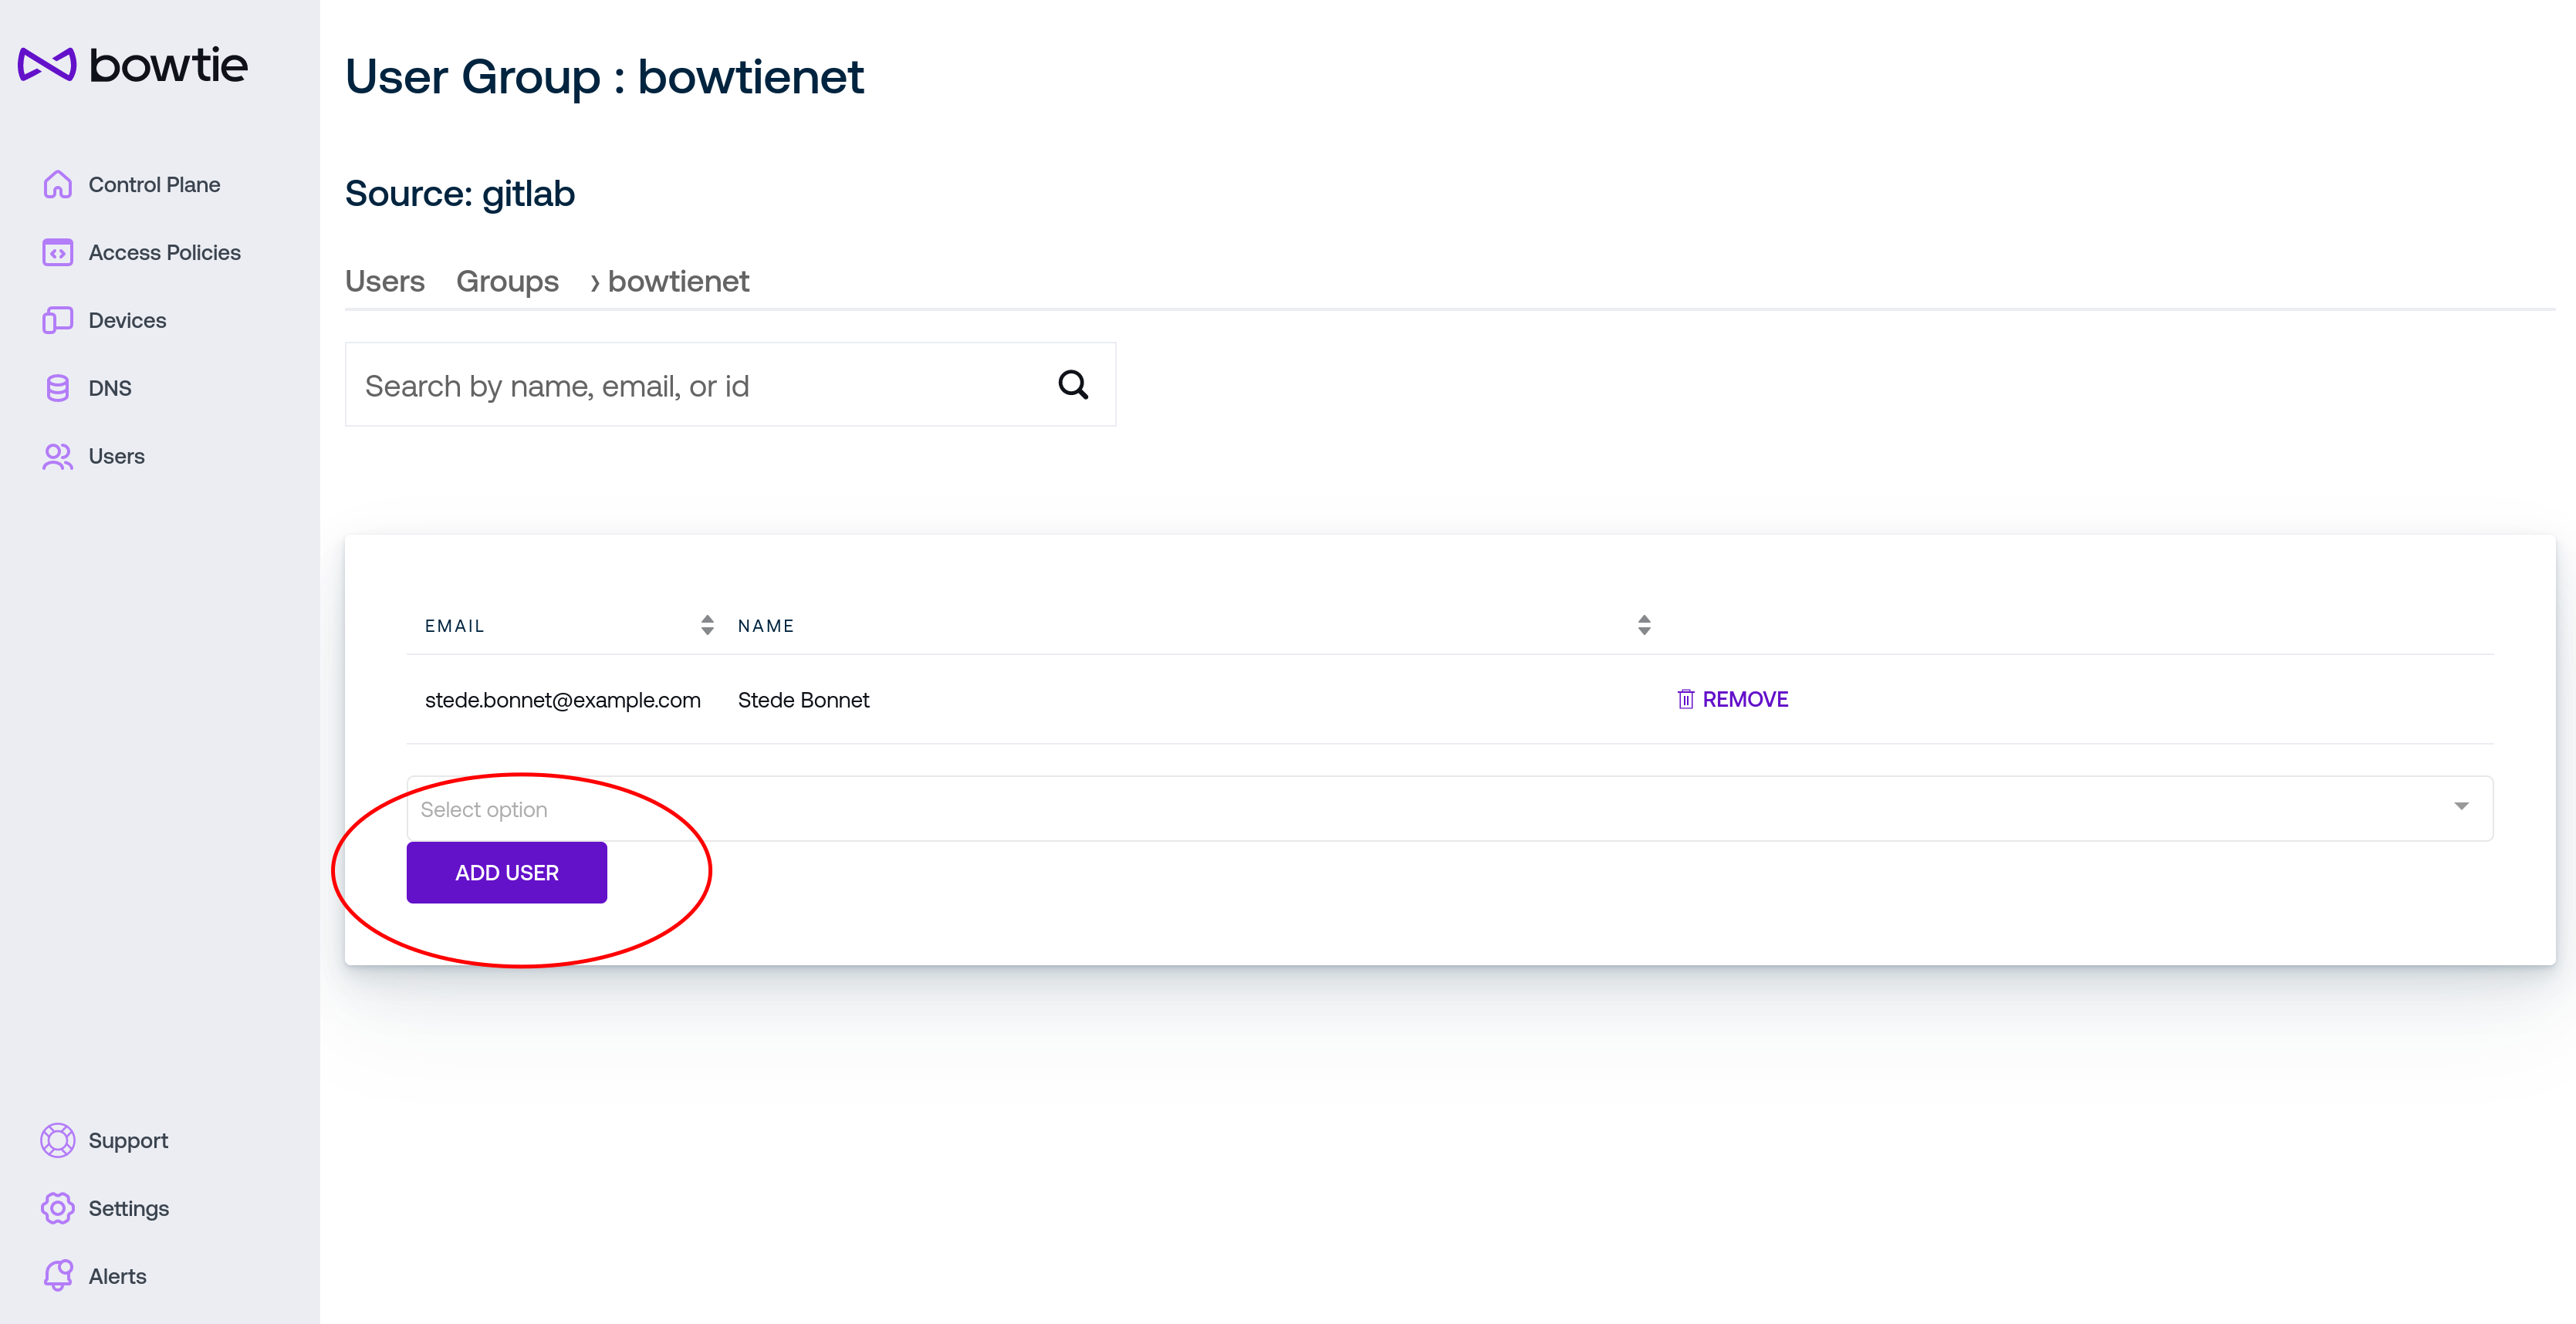
Use the Remove link on members of the group to remove them from the group.
Settings
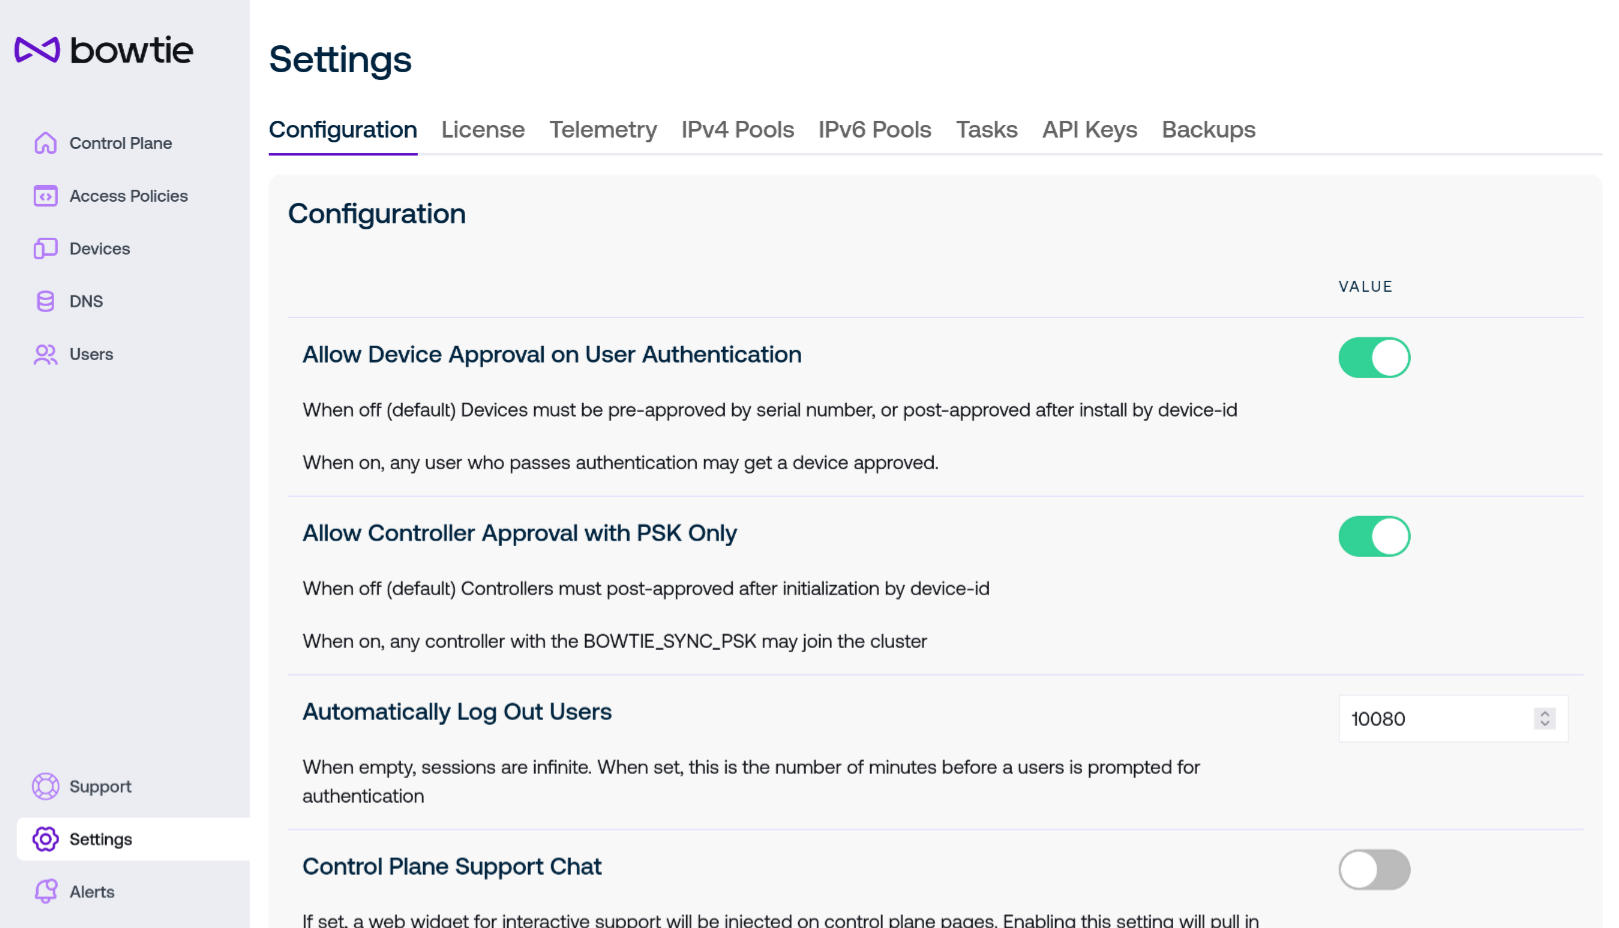
Settings provide a variety of configurable options for Controller behavior. In the main Configuration tab, these settings are:
Allow Device Approval on User Authentication
This option instructs the control plane to automatically Accept devices that are tied to an authenticating user on that device. This can be useful within environments where single sign-on providers are inherently trusted.
Allow Controller Approval with PSK Only
Normally, new Controllers joining an existing control plane must present a valid
BOWTIE_SYNC_PSKvalue and then be Approved to join the cluster. When this option is enabled, only the first requirement is enforced: any Controller that presents a validBOWTIE_SYNC_PSKwill immediately join the cluster as an accepted device.
Automatically Log Out Users
Administrators may choose to enable this option to enforce stricter session expiration for end users.
Enable Failed Login Throttling
When enabled, users who exceed the configured number of failed login attempts will have their authentication attempts denied until the decay period passes. Used to prevent brute force attacks against user accounts. Defaults to enabled as a secure default.
Note that this applies to password-based logins; if single sign-on is in use, you may need to consult with your identity provider if you would like to enforce similar constraints for SSO based logins.
Failed Login Throttling Threshold
After the indicated number of failed login attempts, Controllers will throttle future login attempts by denying the login attempt until the period indicated by the following Failed Login Decay Period lapses and the total number of failed attempts falls below the threshold.
Failed Login Decay Period
Failed login attempts are retained for the indicated period of time and count against the threshold defined by the Failed Login Throttling Threshold setting. After this period, a failed attempt expires and will no longer count against the failure threshold.
Control Plane Support Chat
Enabling this option will offer Chat Support on all control plane pages as long as the criteria have been met. Refer to Chat Support for additional information about chat-based Enterprise support.
Support Domains
Define one or more domain names that may be used with Chat Support. Note that any domains listed here must be validated and approved by Bowtie before initiating any chat-based support sessions and any users initiating a new chat support session must have an email address beneath an approved domain listed here.
Web Filtering
The settings in this section enable administrators to optionally choose Collections that the Control Plane will block from HTTP and HTTPS access.
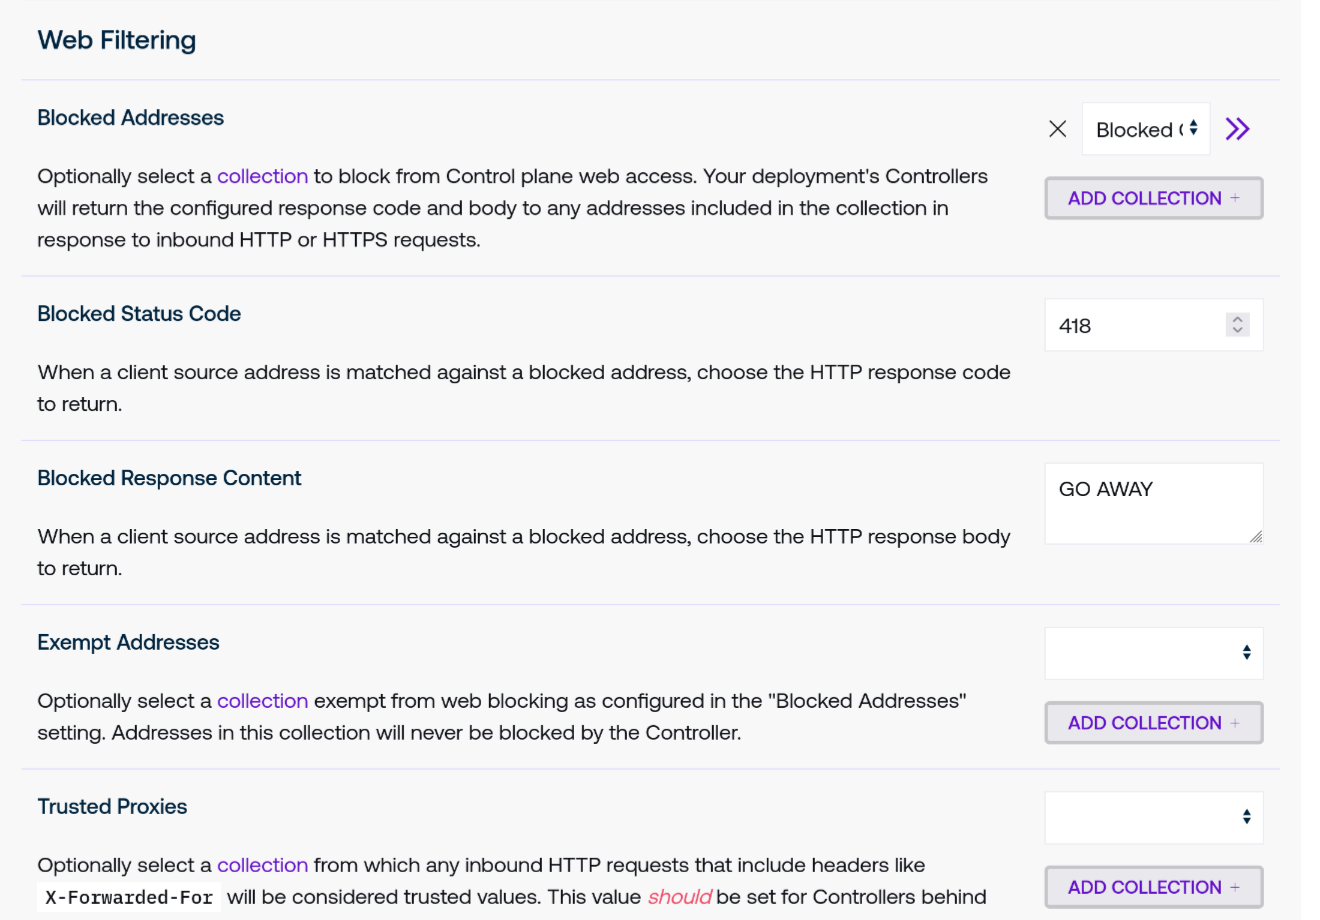
Blocked Addresses may be set to a collection that will be matched against any inbound client HTTP and HTTPS connections to the Control Plane. If the client address matches one of the members of this collection, the Controller will respond with the indicated status code and response body.
This setting applies to any inbound web request, whether to the Control Plane web UI or other endpoints served by the Controller’s endpoints like Grafana.
Blocked Status Code permits a custom status code value to return against blocked requests.
Blocked Response Content permits a custom response body content to return against blocked requests.
Exempt Addresses is an optional collection that will exclude any matching client addresses from the pool of blocked addresses.
Trusted Proxies is an optional collection that the Controller will use to determine whether a network peer sending header values that set true client IP information (like
X-Forwarded-For) may be trusted. While not necessary for Controllers on public networks without an upstream load balancer, we strongly suggest that Controllers behind load balancers do set this to either an address or CIDR that matches upstream load balancers to ensure that real client IPs are used to match potential blocked range matches. Failure to do so may risk blocked ranges failing to apply correctly.This setting applies to all Controllers that do not have their own custom trusted proxies set. To choose a separate Collection that applies only to individual Controllers, use the Controller Settings page.
Allow Temporary Console Users
Enable temporary, serial-console limited host appliance user account creation via Console Access. This setting may also be set on a per-Controller basis and accounts may only be created if the setting is enabled both organization-wide and on individual Controllers. This feature is enabled by default but subject to many restrictions: temporary users have a limited valid login window, may not occur over
ssh, and will have their sessions forcibly terminated after their validity expires.
SSH Listener Defaults
Optionally restrict where inbound
sshconnections are allowed to originate from. This setting will be referenced by Controllers that do not provide any individually overridden setting.
Controller Version Defaults
Each version/update related setting provides organization-wide defaults for Controllers that do not otherwise provide specific overridden settings. See Controller version settings for an overview of version, splay, and age related settings descriptions.
SSO Configuration
Rather than uploading configuration files for Single Sign-On support via
scporssh, you may instead upload both configuration files and optional certificates to reference in those configuration files via the Control Plane web interface.
Prometheus Scrape Configuration Files
To configure additional scraping endpoints for Prometheus, you may upload YAML configuration files here. See Observability for additional information.
These configuration options are subject to expand over time.
Licensing
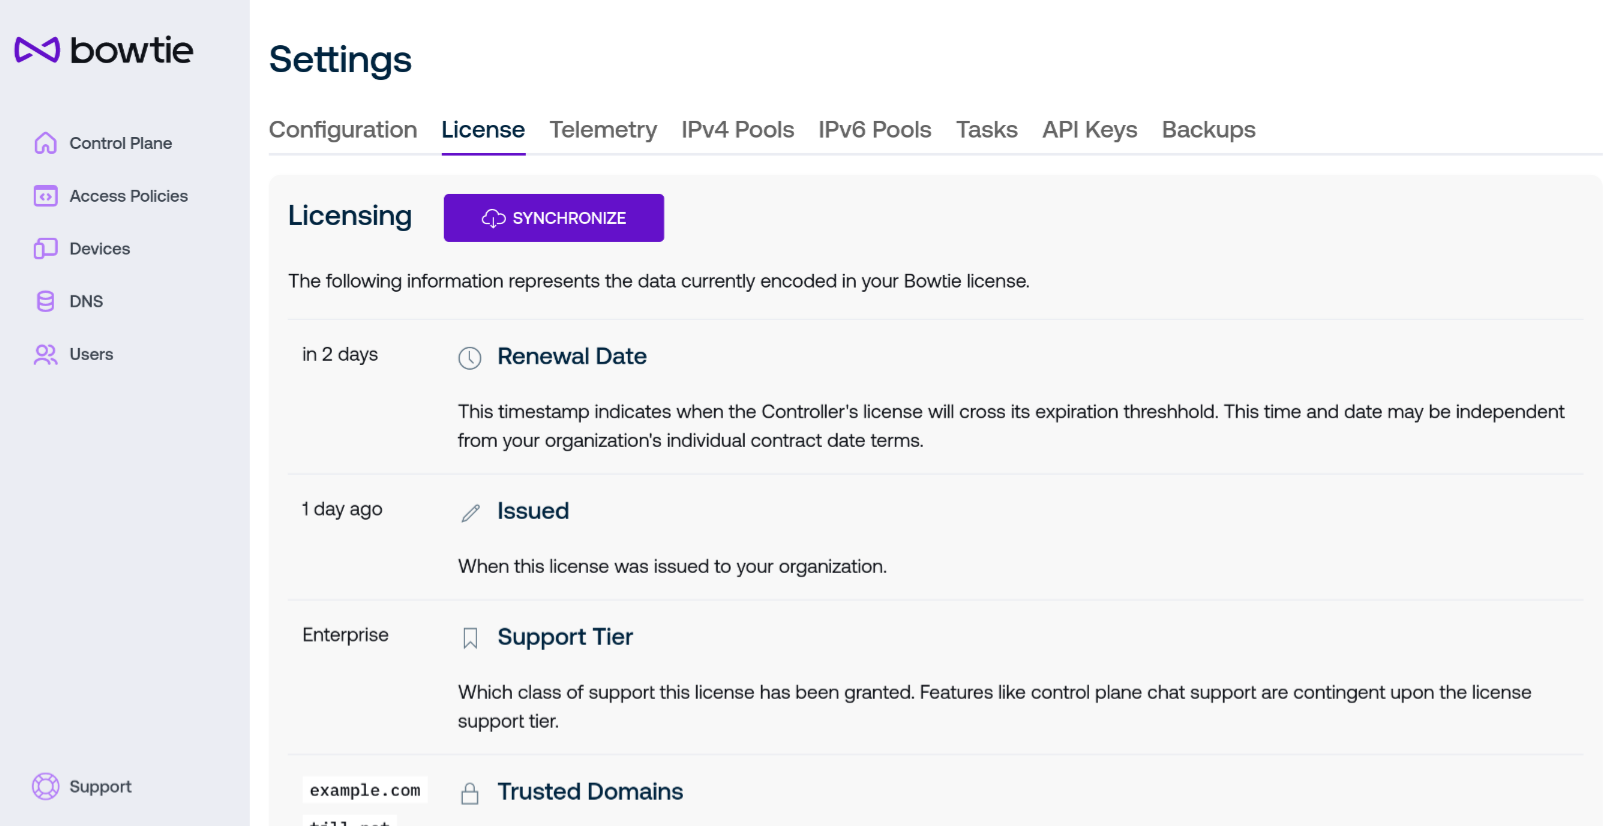
Your Bowtie deployment is associated with a license coupled to your organization. The licensing page displays the information encoded into your Bowtie license along with the ability to forcibly refresh your license to retrieve any potentially new privileges it may grant.
Use the Synchronize button to the right of the header to force-refresh the license granted to your deployment. This functionality does not incur any additional costs or metrics and is meant primarily as a way to ensure your installation is using the latest license available from the Bowtie licensing server. License information will synchronize automatically at a regular interval without any user interaction.
The table on this page lists the following:
Renewal Date
Each license has an expiration date which is displayed here. Hover over the displayed time to see a concrete, UTC-oriented timestamp.
If your installation’s license has expired, reach out to a Bowtie representative who will be able to assist you. In most cases, an expired licenses is primarily meant as an aid for contractual agreements and will not actively degrade the capabilities of the product.
Issued
When this license was issued. This value is unlikely to change frequently.
Support Tier
Your license is associated with a support tier that dictates what level of assistive support granted to your organization. The level of support granted by your license will be displayed here.
Trusted Domains
When leveraging chat-based control plane support, only users with emails associated with the listed domains may be eligible to initiate chat-based support sessions. This measure is enforced to avoid user impersonation. Use the Settings page to add domains to this list.
Last Update
Indicates the time at which your license was last retrieved from the Bowtie licensing endpoint.
Telemetry
Controllers send periodic telemetry payloads to Bowtie. Telemetry contents are configurable on this page.
As advocates of self-hosted and independently operated infrastructure, we strive to be transparent about the telemetry data that we collect and fully inform administrators about what data it includes. The telemetry settings page is designed to make these decisions clear and configurable.
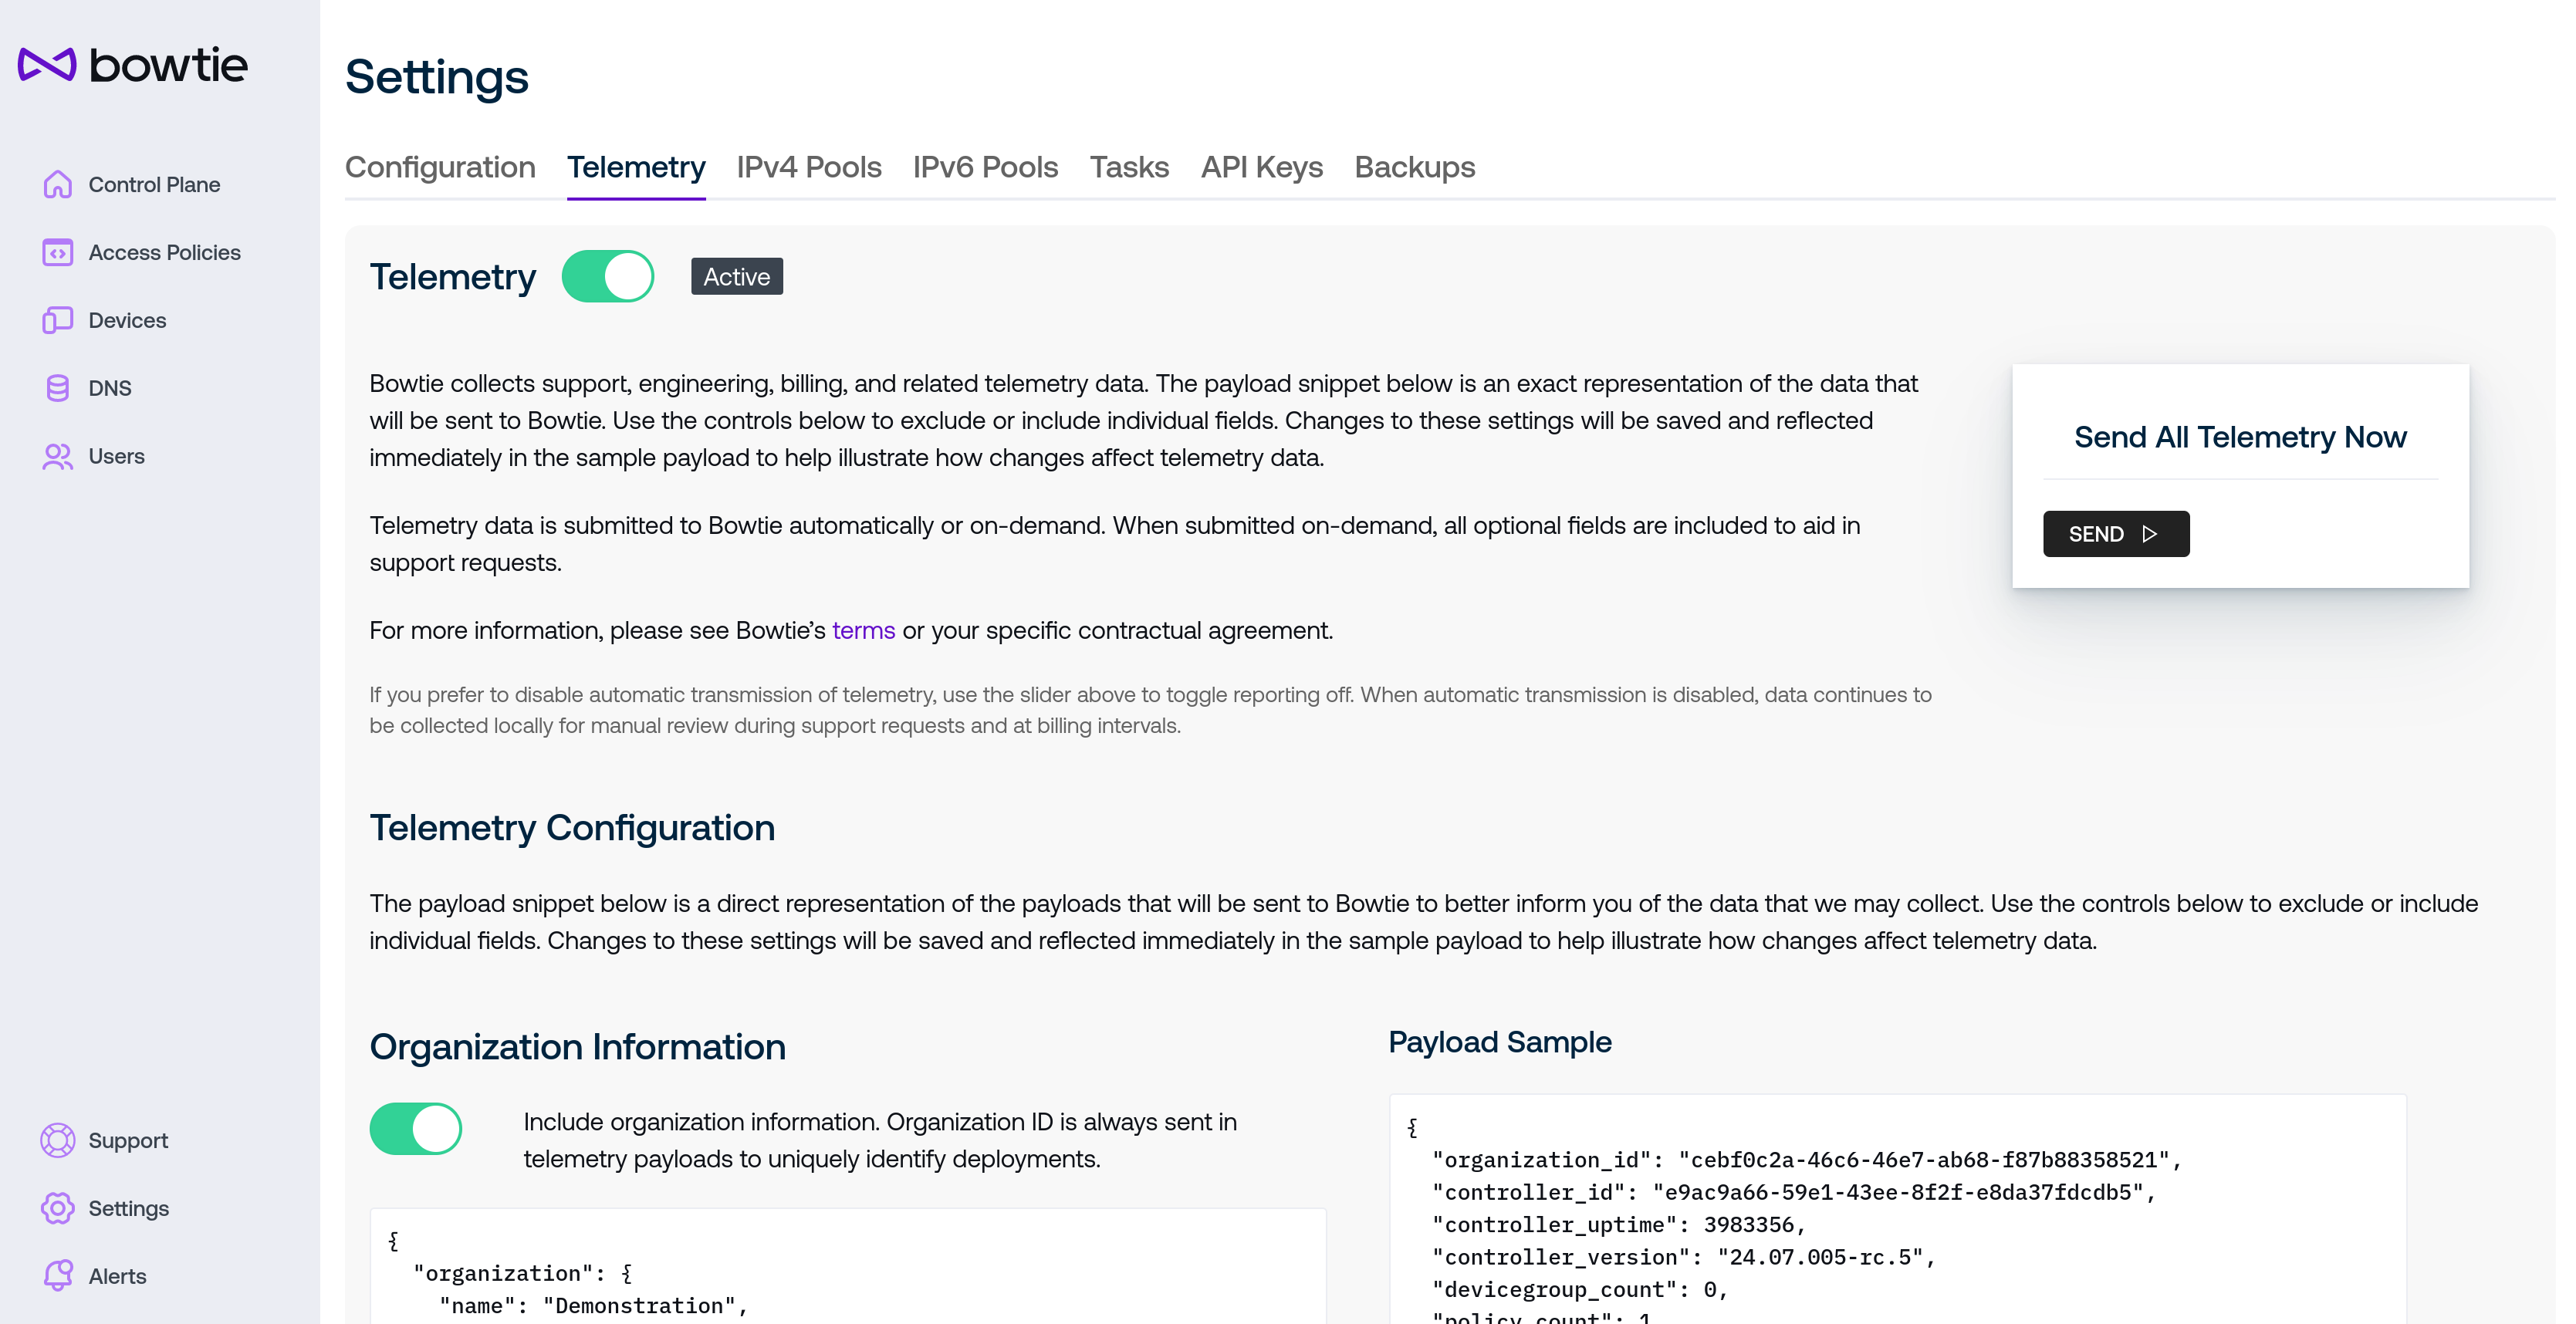
Telemetry collection is enabled by default but may be toggled off using the slider next to the Telemetry header. Note that this setting applies to potential future telemetry collection and does not retroactively delete any telemetry already sent to Bowtie. Toggling this setting applies the preference immediately, although telemetry collection may not occur immediately and will trigger based upon the Controller’s internal timing.
The box to the right of the descriptive text is available in the event that operators may want to send Bowtie telemetry in a one-off event. This functionality is intended in special cases such as diagnostic or support cases. This capability will send all applicable fields and is independent of the periodic telemetry preferences in the following section.
The remaining section controls the fields that are included in the periodic telemetry payloads if telemetry is actively enabled. Changes made in this section are applied immediately:
The left-hand column controls the inclusion or exclusion of certain categories of telemetry.
The right-hand column is a 1:1 representation of the resulting telemetry payloads as controlled by the preferences in the left-hand column. This helps to illustrate how any desired changes to telemetry preferences will impact the included payload fields. The rendered payload is not sent to Bowtie but a similar payload will be sent the next time telemetry is scheduled for collection by the Controller’s internal timing.
The telemetry fields that Controllers include may change over time but will always be accurately reflected on this page. In general, we try to collect telemetry metrics in aggregate when possible to avoid any information that could be personally identifiable. The only noteworthy exceptions to this rule are the identifiers for organizations and Controllers: although both are opaque identifiers, they are necessary to uniquely address deployments in order to provision licenses accurately.
Organization and Controller identifiers are the minimal set of telemetry that may be sent. If you would prefer that these fields not be sent to Bowtie, you may elect to disable telemetry collection altogether.
Address Pools
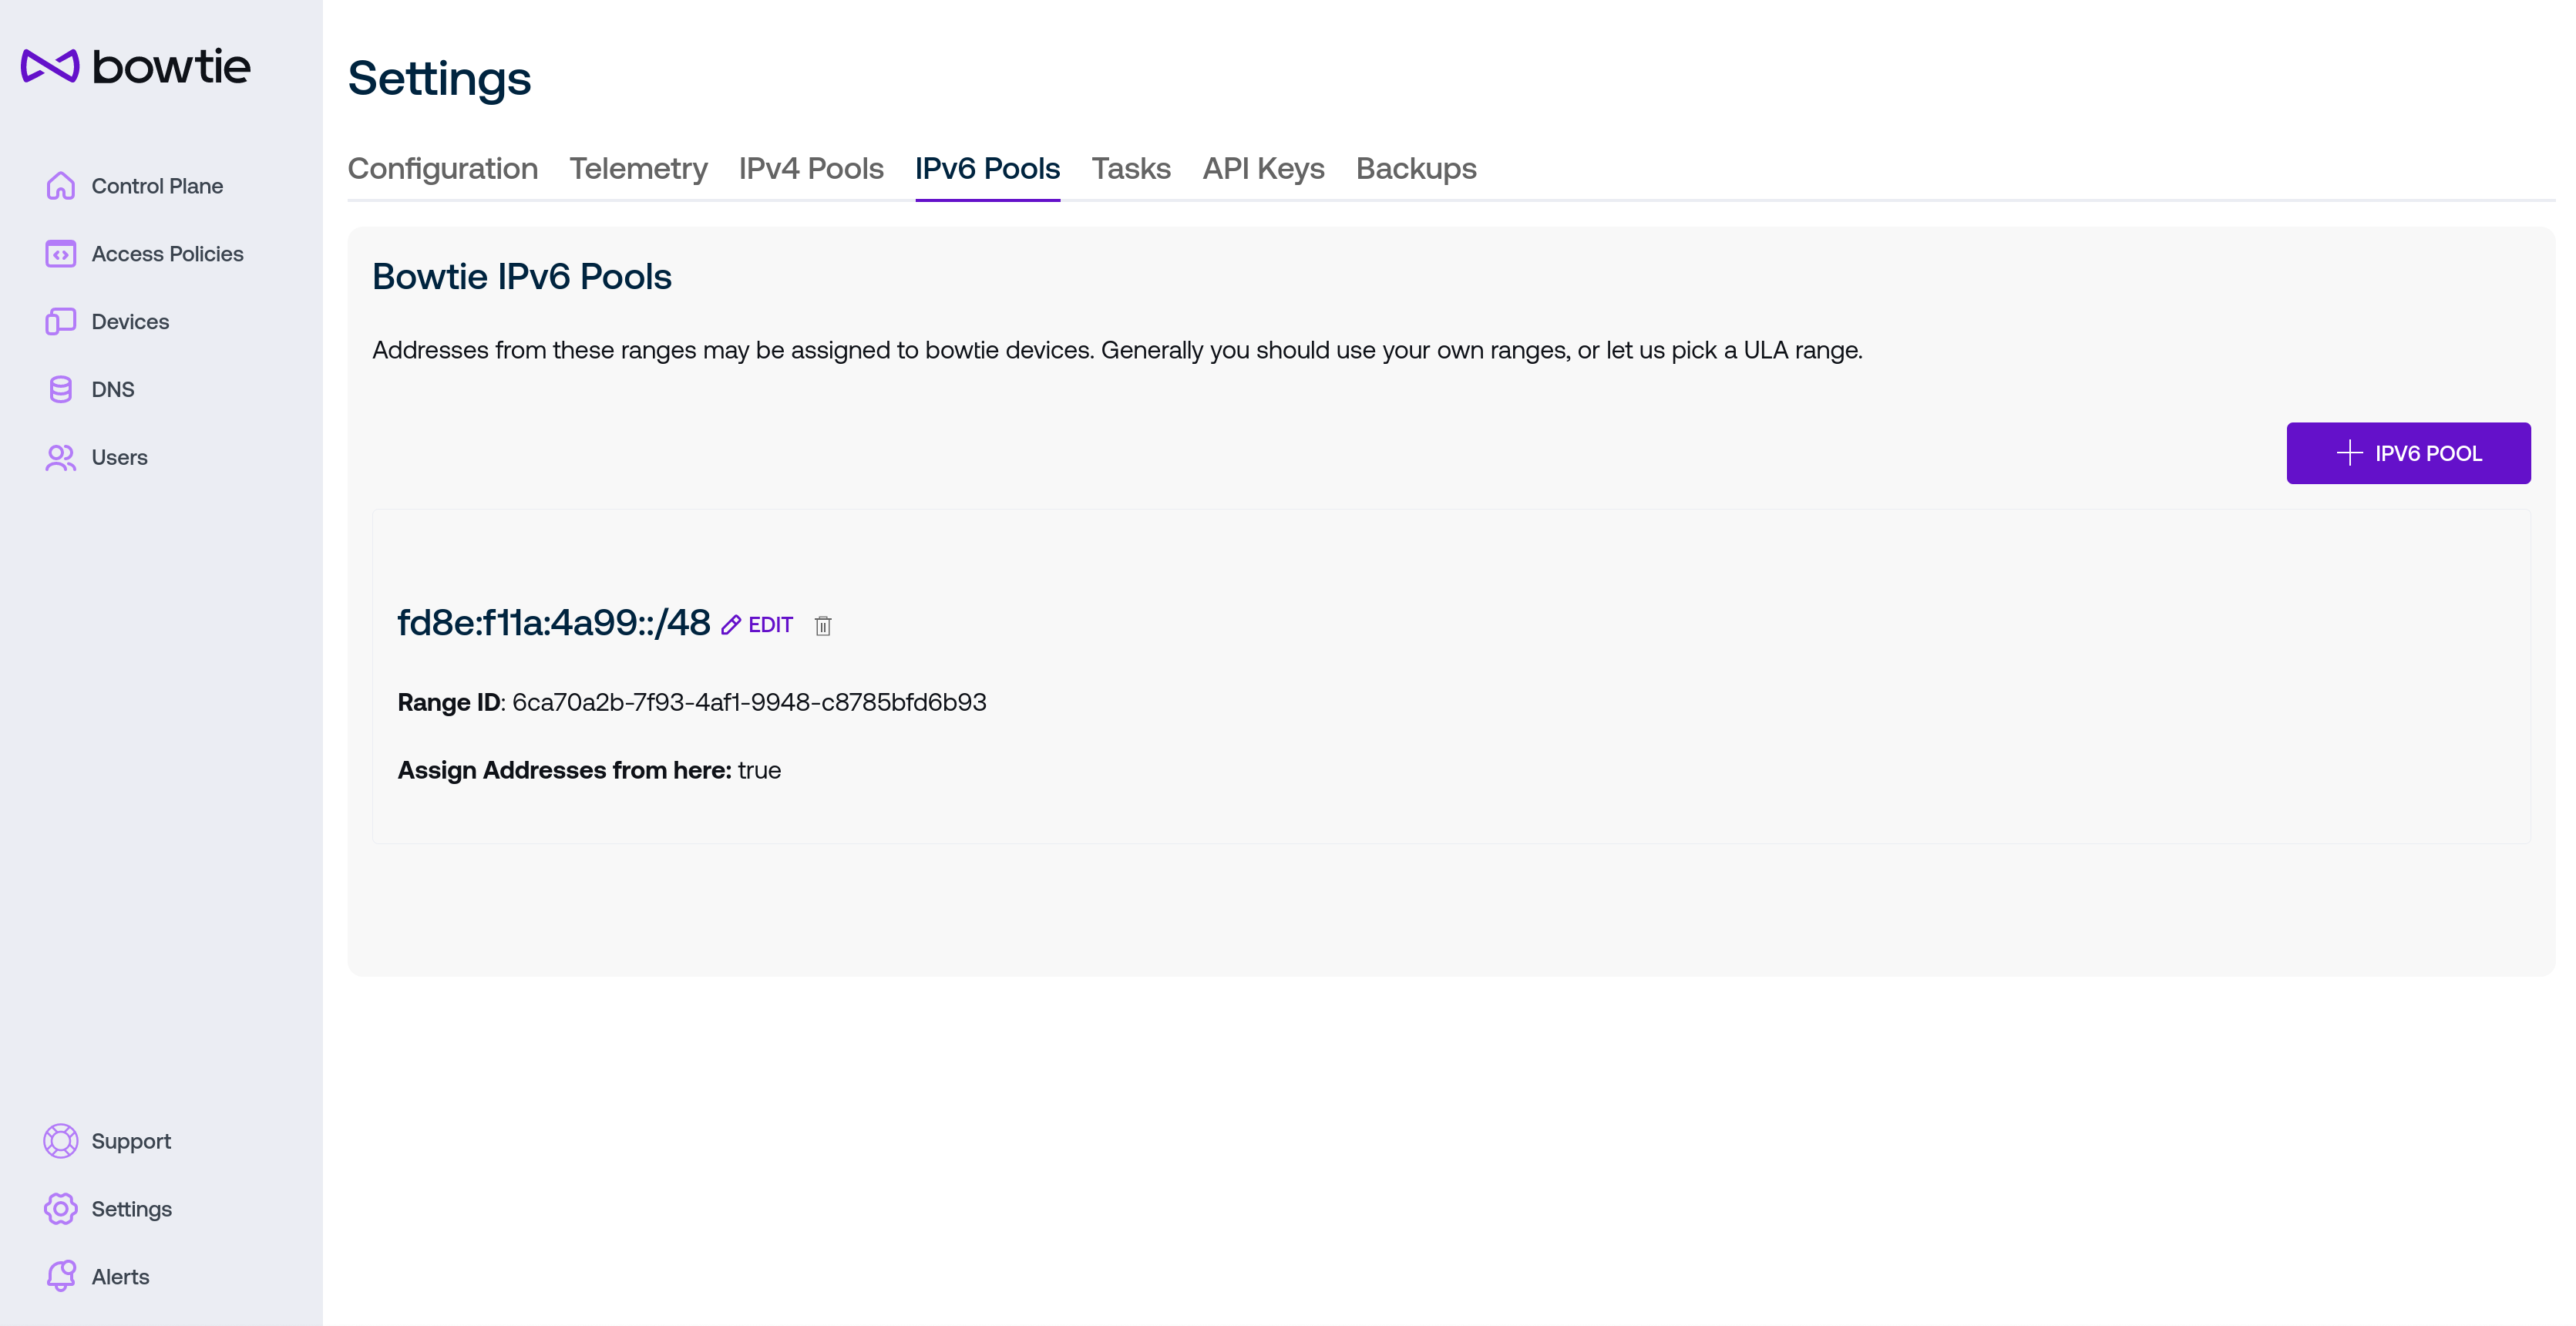
Addresses that are assigned to clients connected to the private network may be customized on this page. By default, Bowtie installations will automatically generate a random IPv6 range used to address client devices. Administrators can optionally customize this default range or add new IPv6 or IPv4 ranges available for assignment.
When defining address pools, bear the following in mind:
Ensure that configured IPv4 ranges do not overlap with any IPv4 ranges defined for your organization’s sites to avoid routing issues.
Every deployment will require at least one IPv6 pool for various features like NAT64 to function correctly.
To add a new IPv4 address, select “+ IPv4 Pool” from the “IPv4 Pools” tab and populate the fields for the new pool:
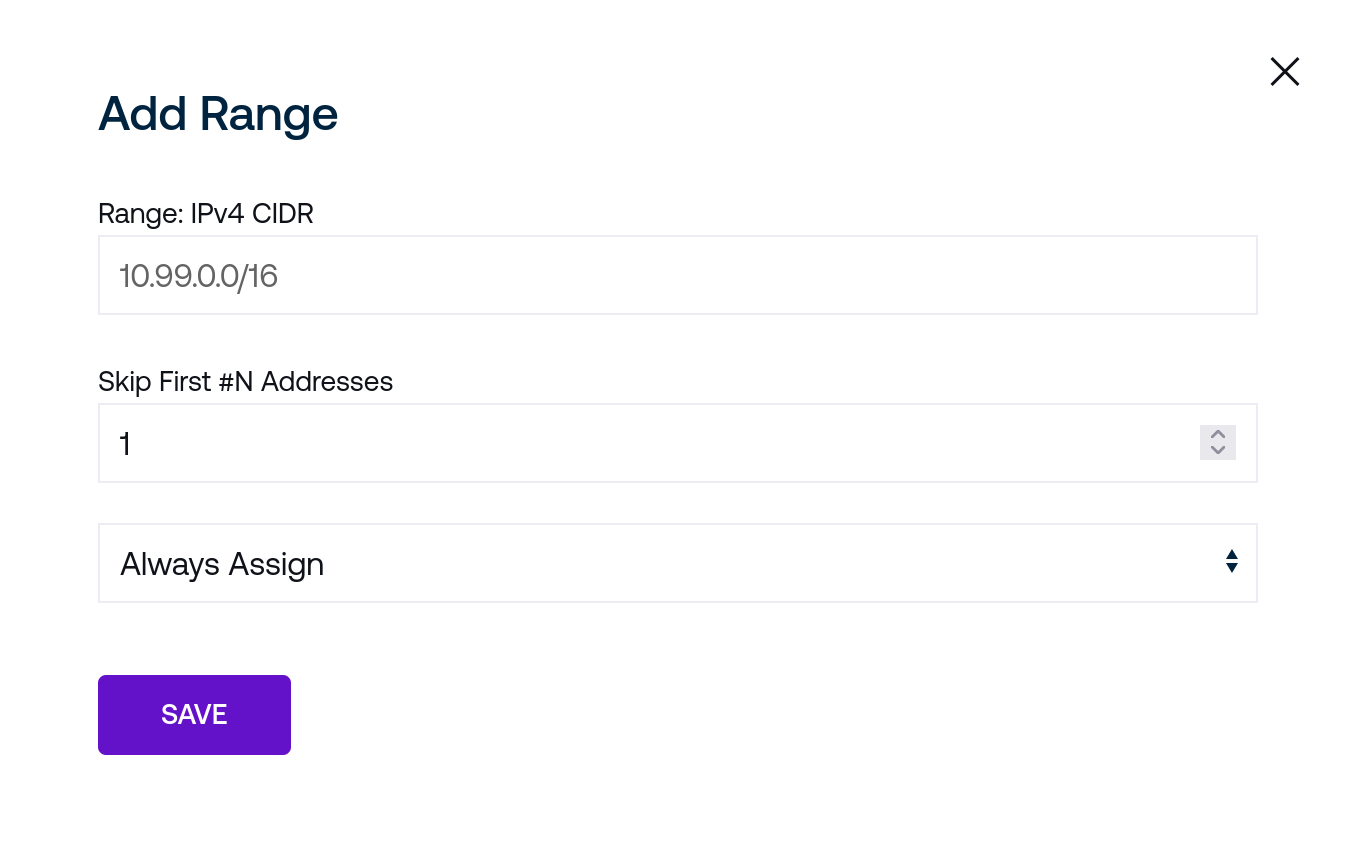
Enter the desired Range for the new IPv4 pool in CIDR notation form. For example, to distribute addresses from a traditional private range pool, enter
192.168.50.0/24in this field.An arbitrary number of initial addresses drawn from this range may be skipped with the second field if, for example, privileged devices have already been allocated addresses at the beginning of the pool range.
Choose how addresses are distributed with the final drop down:
Never will cease distributing addresses from this pool. Bear in mind that some connected devices may still hold leases on allocated addresses.
Choose On Demand if addresses should only be allocated to connected clients when administrative action is taken via either the Organization Devices page or via the Controller Controller REST API. To allocate a new address, either reference the API to do so directly with Controller REST API or use the Organization Devices page.
Choose Always to always allocate an IP address from this pool to connected clients.
IPv6 address pools may also be added from the IPv6 Pools tab. IPv6 pools are sufficiently large that users may either enter or auto-generate a desired range, and a simple checkbox will determine whether or not to distribute addresses from the given range.
Edit or delete IPv4 or IPv6 pools with the Edit or trash can icons, respectively.
Tasks
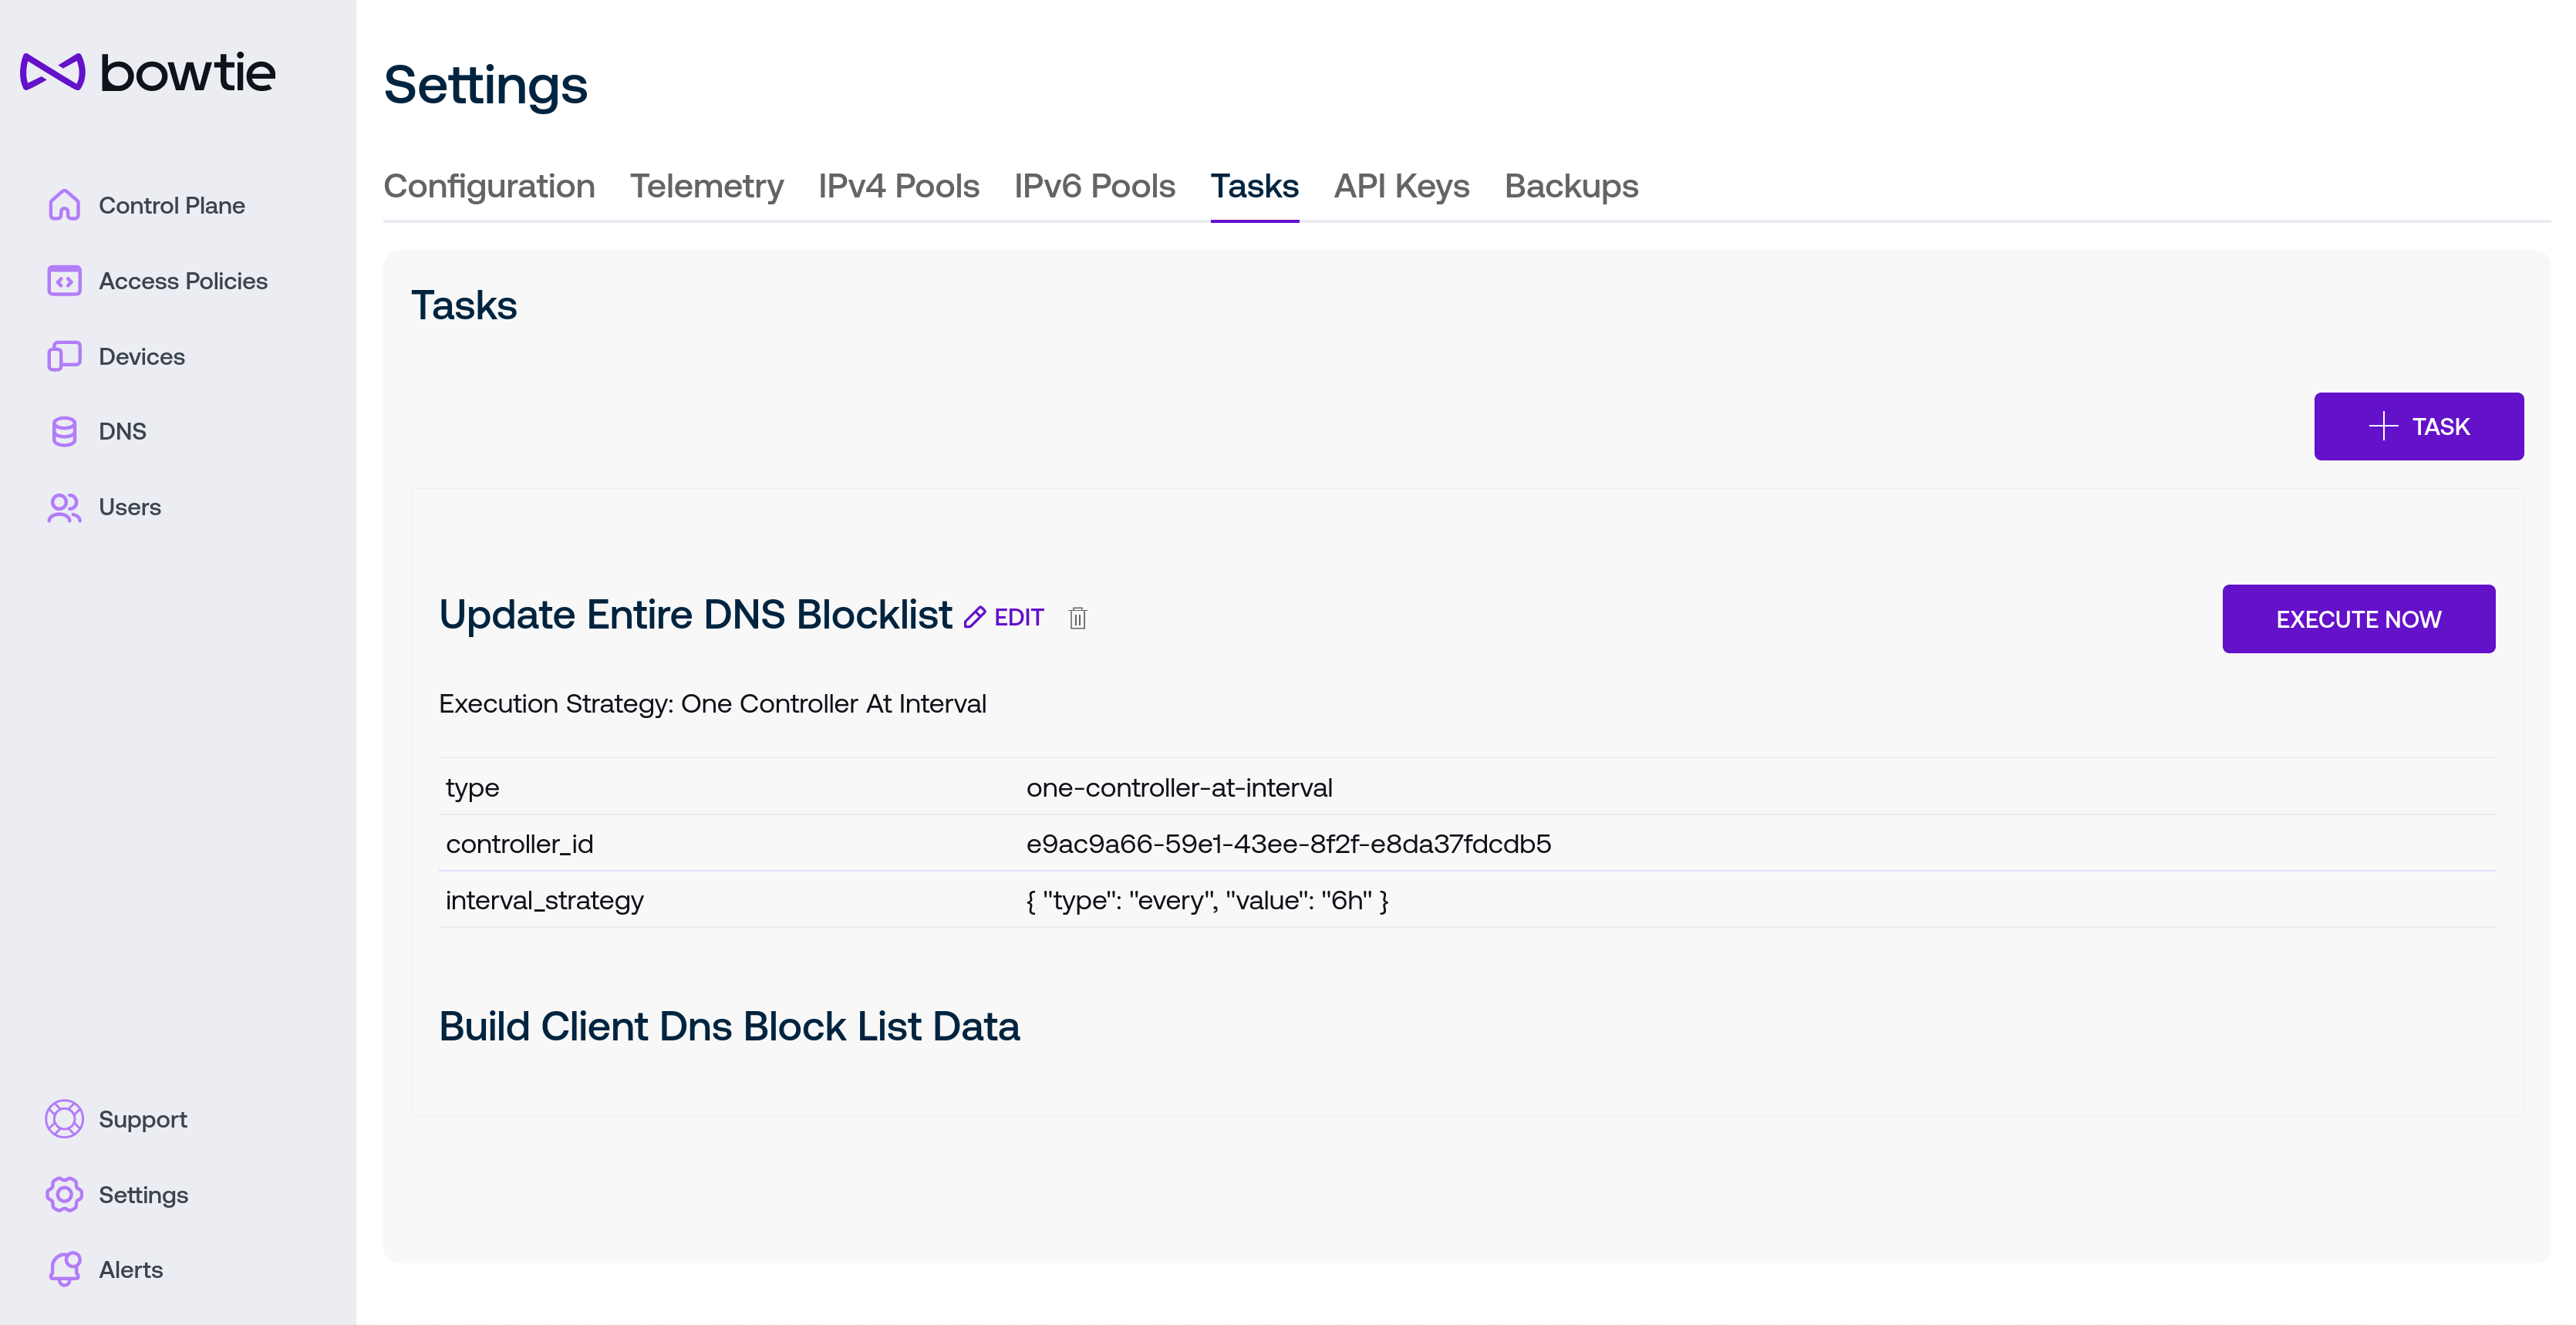
The Tasks tab exposes a number of low-level settings for customizing the behavior of background tasks that Controllers may execute.
In the included screenshot, a previously-created block list has an accompanying task to periodically refresh the blocklist by retrieving the remote URL for updated content (this type of task is automatically created for block lists that point at remote URLs). Block list updating is one example of a task: a background that runs in the background, potentially on a periodic basis.
New tasks can be created with the + Task button. Each existing task may be edited or deleted with the Edit or trash can icon next to the task’s name or executed immediately with the Execute Now button.
The following sections describe each type of task and its associated settings.
DNS Block List Updater
Block lists directed at remote URLs fetch remote content on a periodic basis based on this task. After creating a new block list, these type of tasks are automatically created and the following fields are configurable for each task:
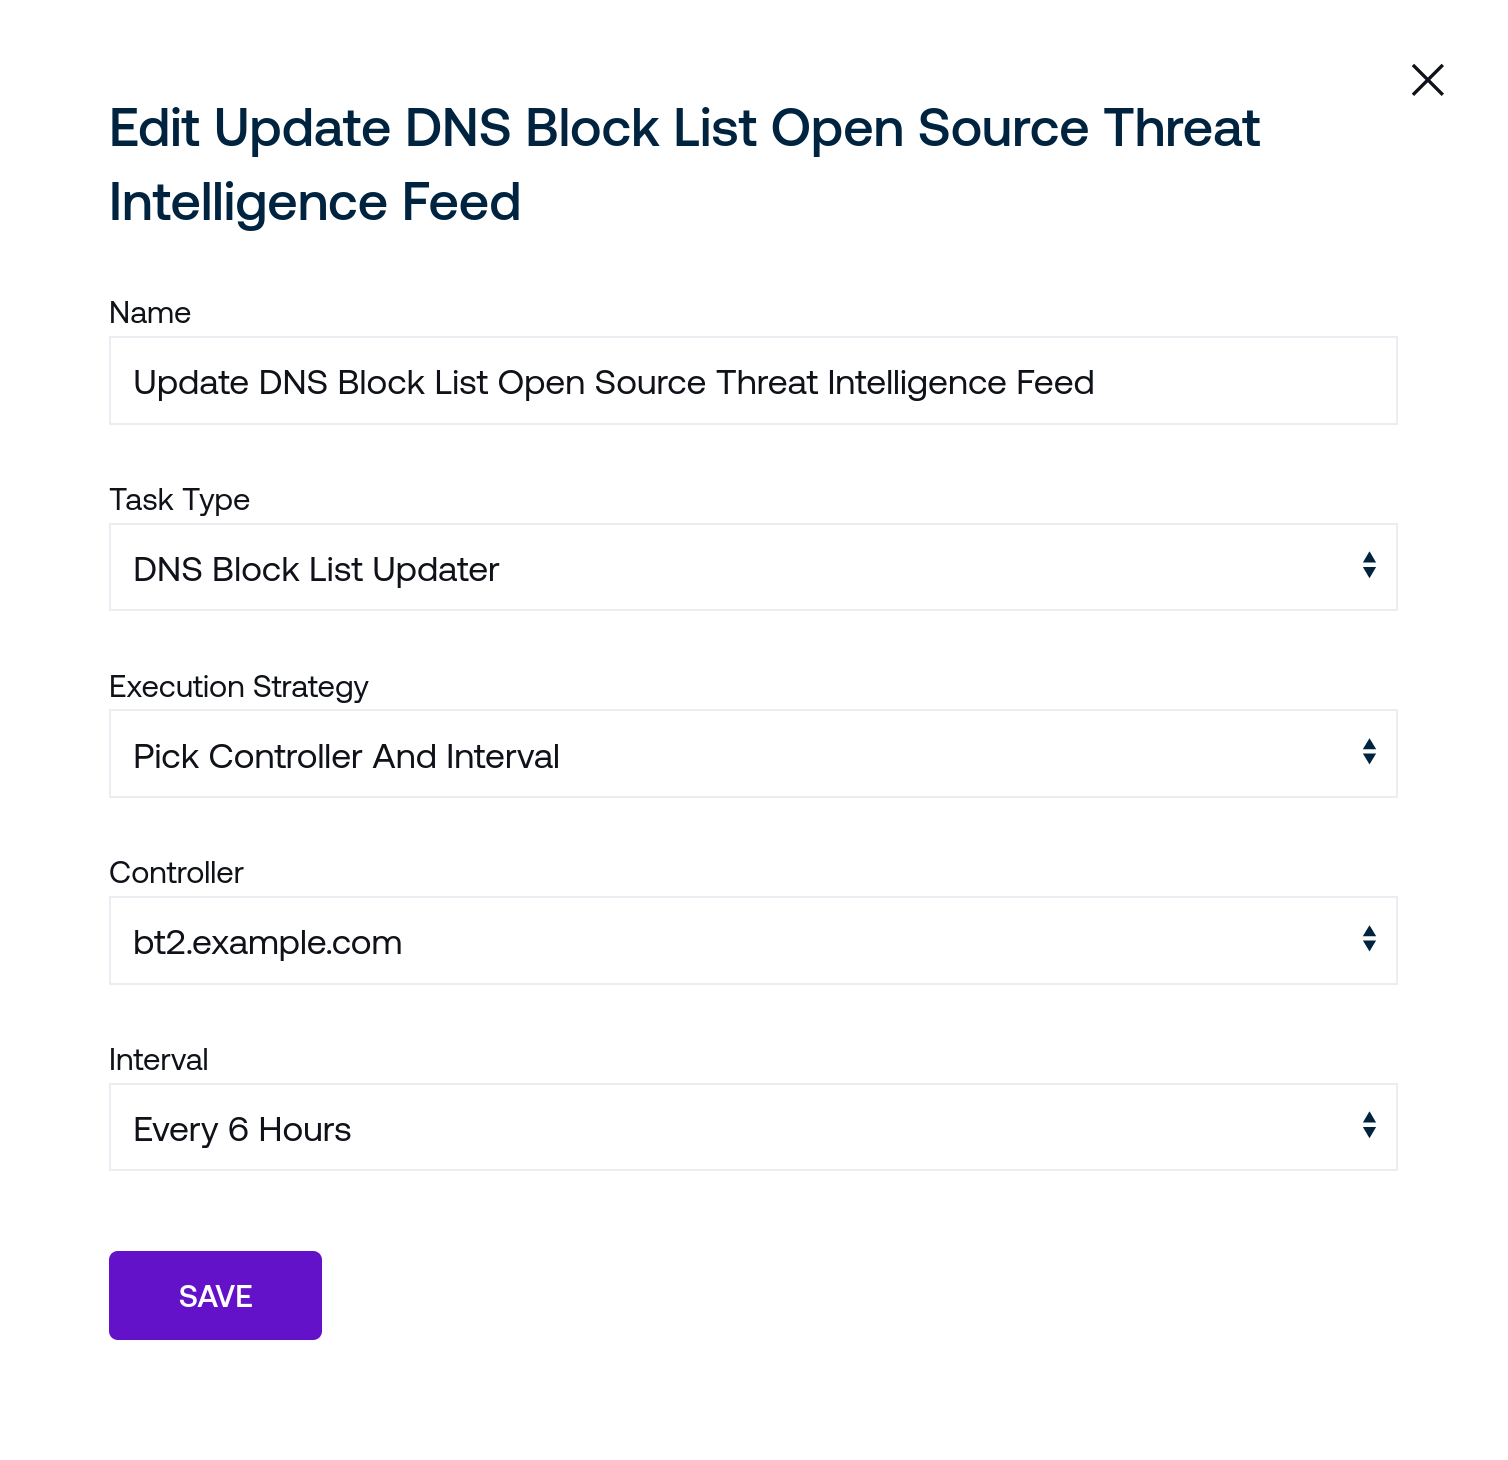
Name is a human-readable name for the task. Block list update jobs are identified internally by unique IDs, so this may be safely changed without impacting other settings.
Task Type identifies the task as a block list updater.
Execution Strategy presents the options available to select how the task will run:
On Demand indicates that the task will only ever run after being triggered from the web interface or via the web API.
Pick Controller And Interval presents Controller field, which is the host that will perform the task based on the interval chosen in the Interval field that appears after selecting this update strategy.
The contextual information presented for the task as it appears in the Tasks tab summarizes these settings.
Build Meta Block List
This task type is created automatically alongside the DNS Block List Updater when DNS Block Lists are created. It takes no special parameters and compiles all block lists into a sanitized form for Clients to use on edge devices.
LDAP Sync
Integrate with an existing LDAP system to synchronize users and groups with their counterpart control plane resources.
Choosing LDAP Sync as a new task presents the following fields to customize the new synchronization task:
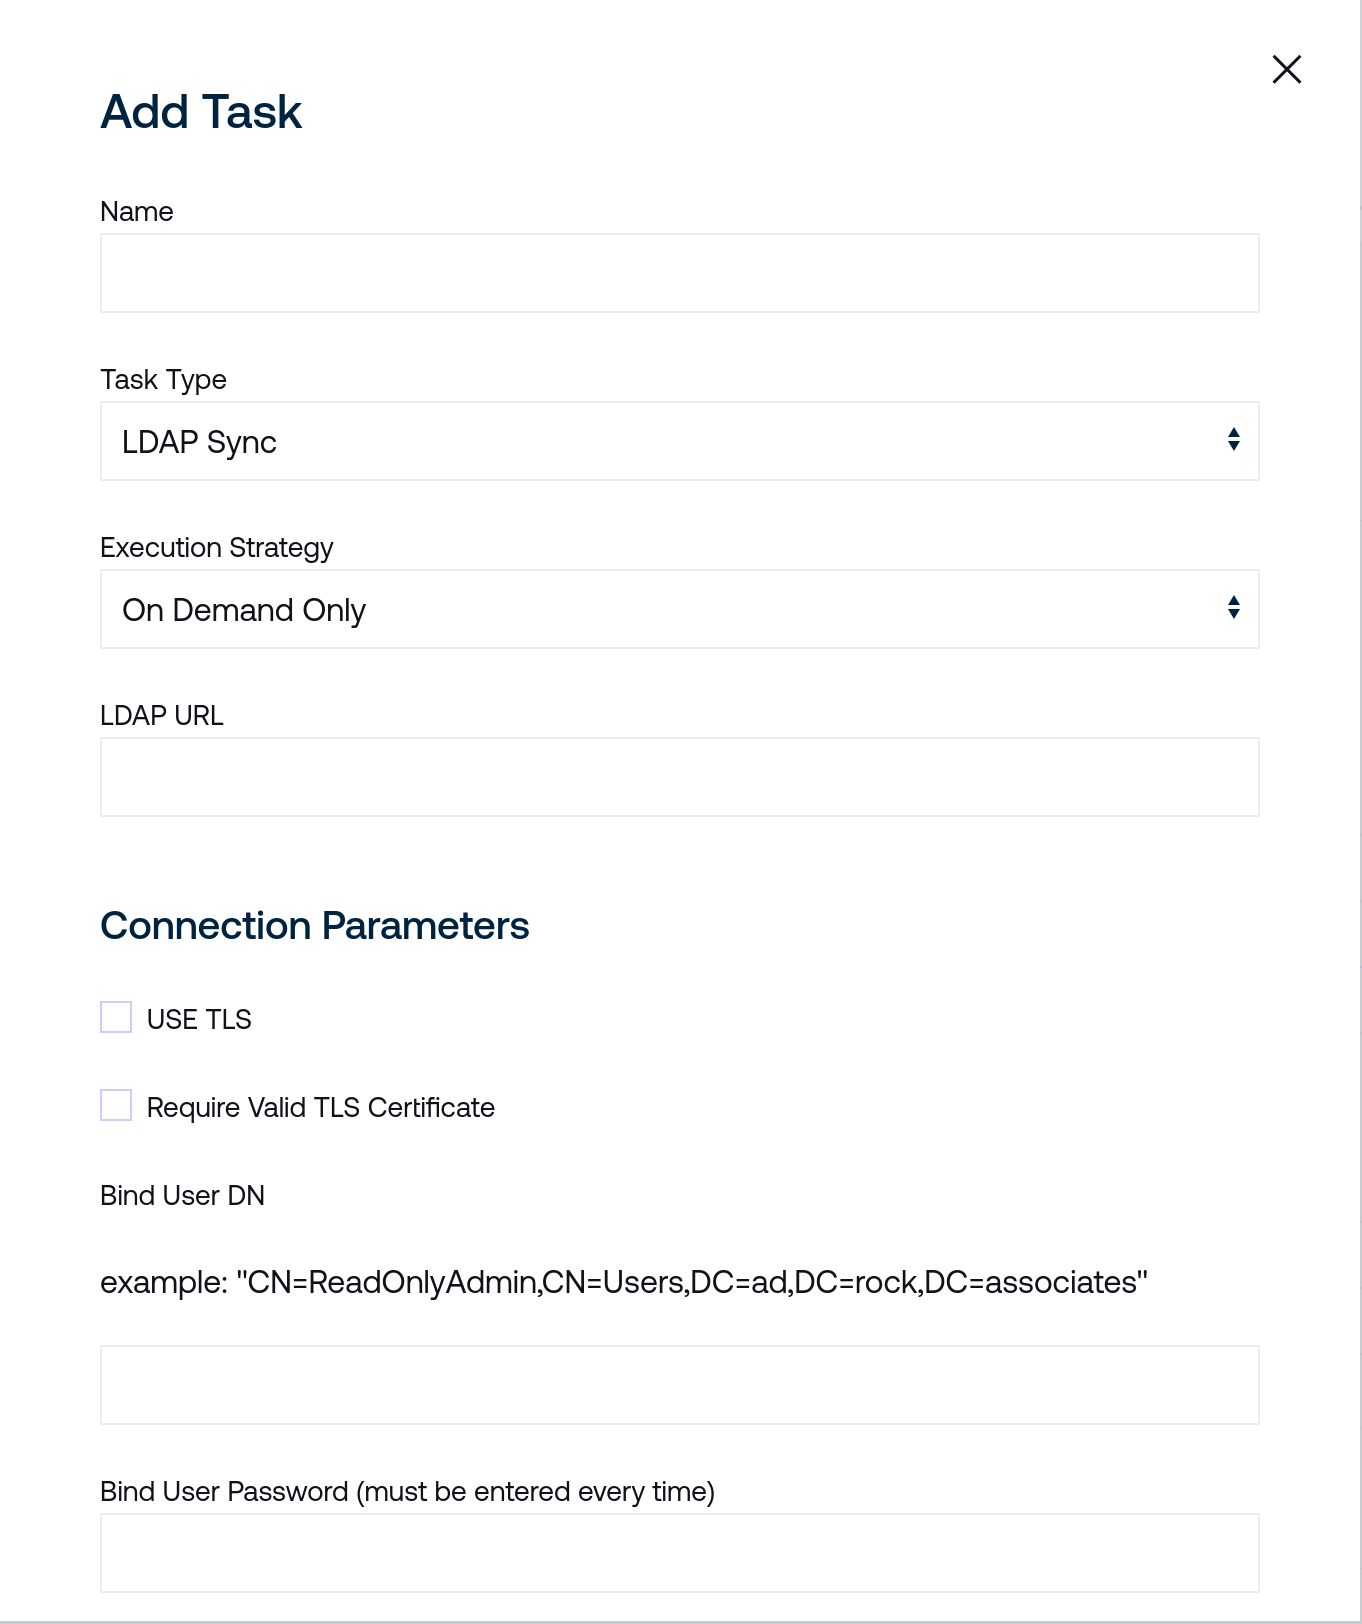
Name is a human-readable name for the task. LDAP sync tasks are identified internally by unique IDs, so this may be safely changed without impacting other settings.
Task Type will be set to LDAP Sync.
LDAP URL should point at your chosen LDAP synchronization source. It should be reachable from the Controller that executes the periodic task.
Connection Parameters presents optional checkboxes to use TLS and require a server certificate signed by a trusted authority.
Bind User DN should be a matching DN for your desired LDAP endpoint along with a valid Bind User Password. An example DN is provided in the accepted format.
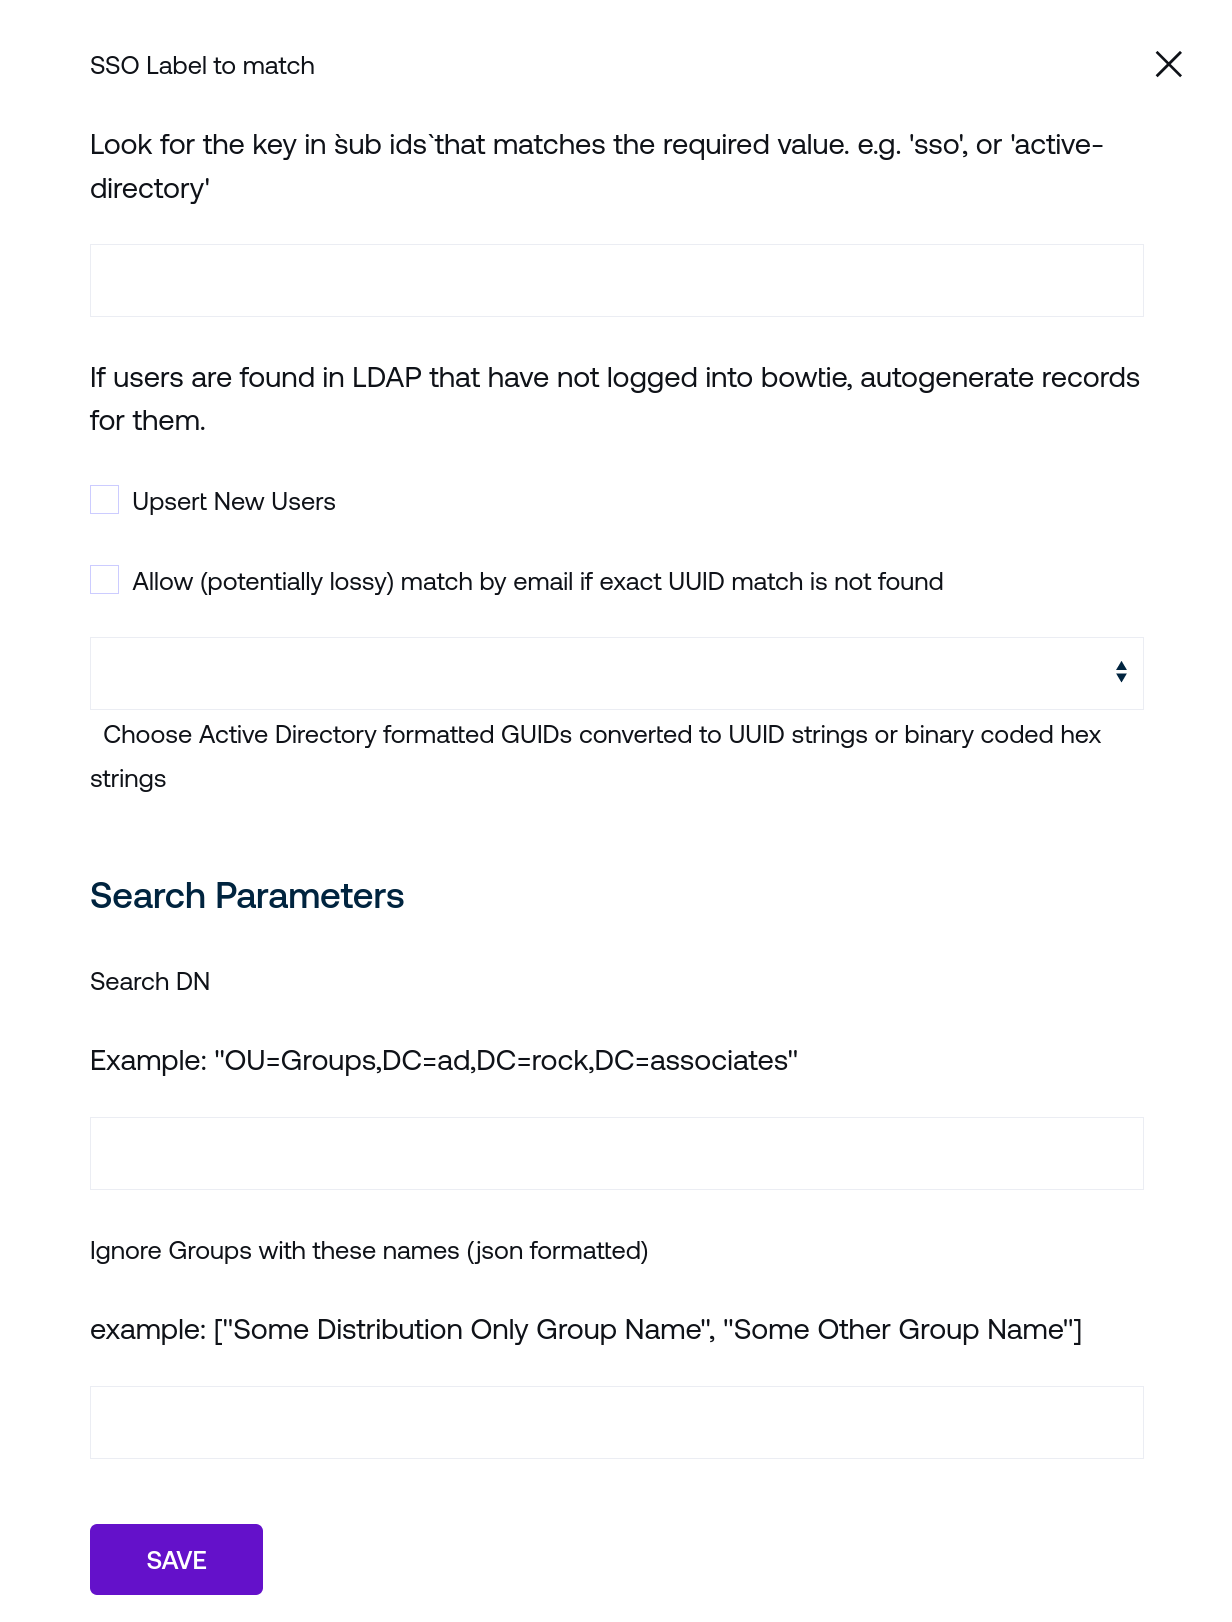
User Matching provides the ability to map single sign-on labels to identifiers fetched from the LDAP server. Additional context is provided in the user interface that may be helpful.
Upsert New Users will instruct the task to create found users if they do not already exist in the list of control plane users. The next checkbox to Allow match by email may be optionally enabled to match users more loosely based on found email addresses rather than UUIDs.
The Search Parameters section should match the desired OU and DC fields to draw from your LDAP server endpoint. Additionally, you may choose to ignore certain groups by entering a JSON-formatted array of strings in the Ignore Groups field.
After filling out the necessary fields, create the synchronization task by clicking the Save button.
Print Hello
This is a simple task meant for debugging purposes to ensure that the task running system is working as expected.
After creating this task type, messages of the following form will appear in the system logs for bowtie-server.service if the task system is operating normally:
Hello from your task runner at <timestamp>
API Keys
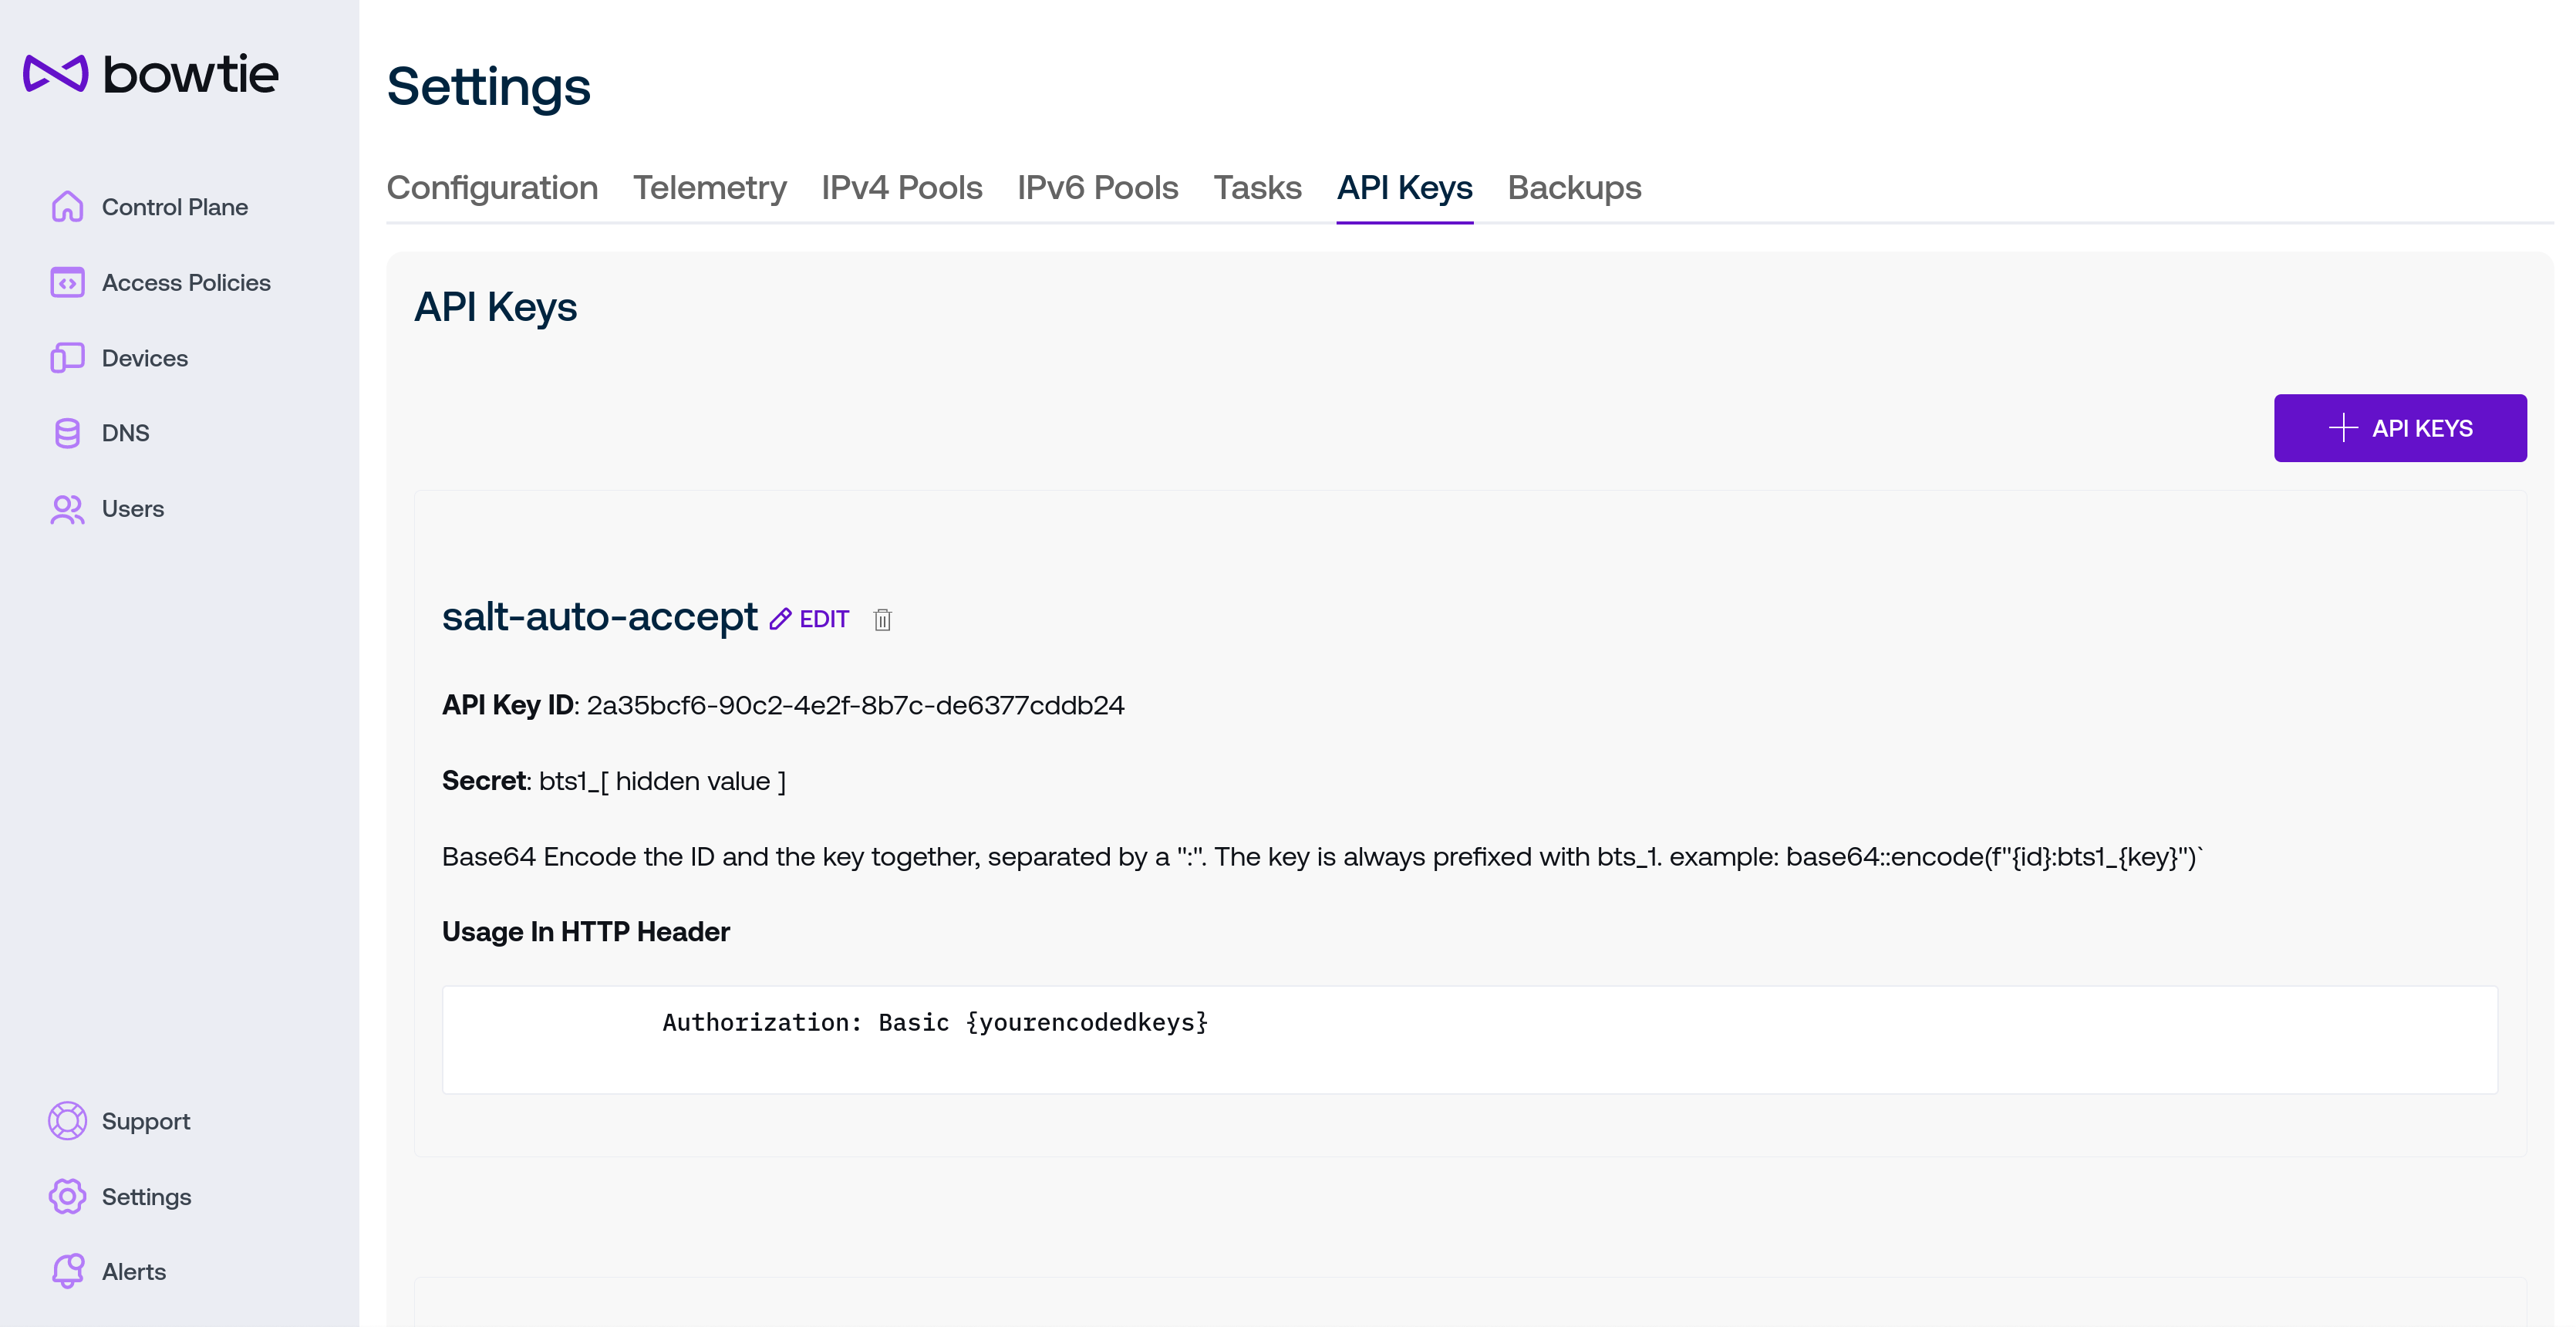
API keys may be used to authenticate calls over the Bowtie control plane API. This is often useful to automate tasks like accepting devices or making other changes over the API rather than the web interface.
Use the + API Keys button to create a new API key and enter a human-readable name to identify the API key later. Note the secret Key for later use as it will not be shown again.
The new API key will appear in the table listing along with instructions for how to use the new API key ID and secret in REST calls.
The method for using API keys can be summarized with the following shell code using curl to retrieve a list of devices from the control plane API:
key_id="<your key>"
secret="bts1_<your secret>"
curl --user $key_id:$secret https://bt1.aws.example.com/-net/api/v0/device
For additional information about using the Controller API, see Controller REST API.
Backups
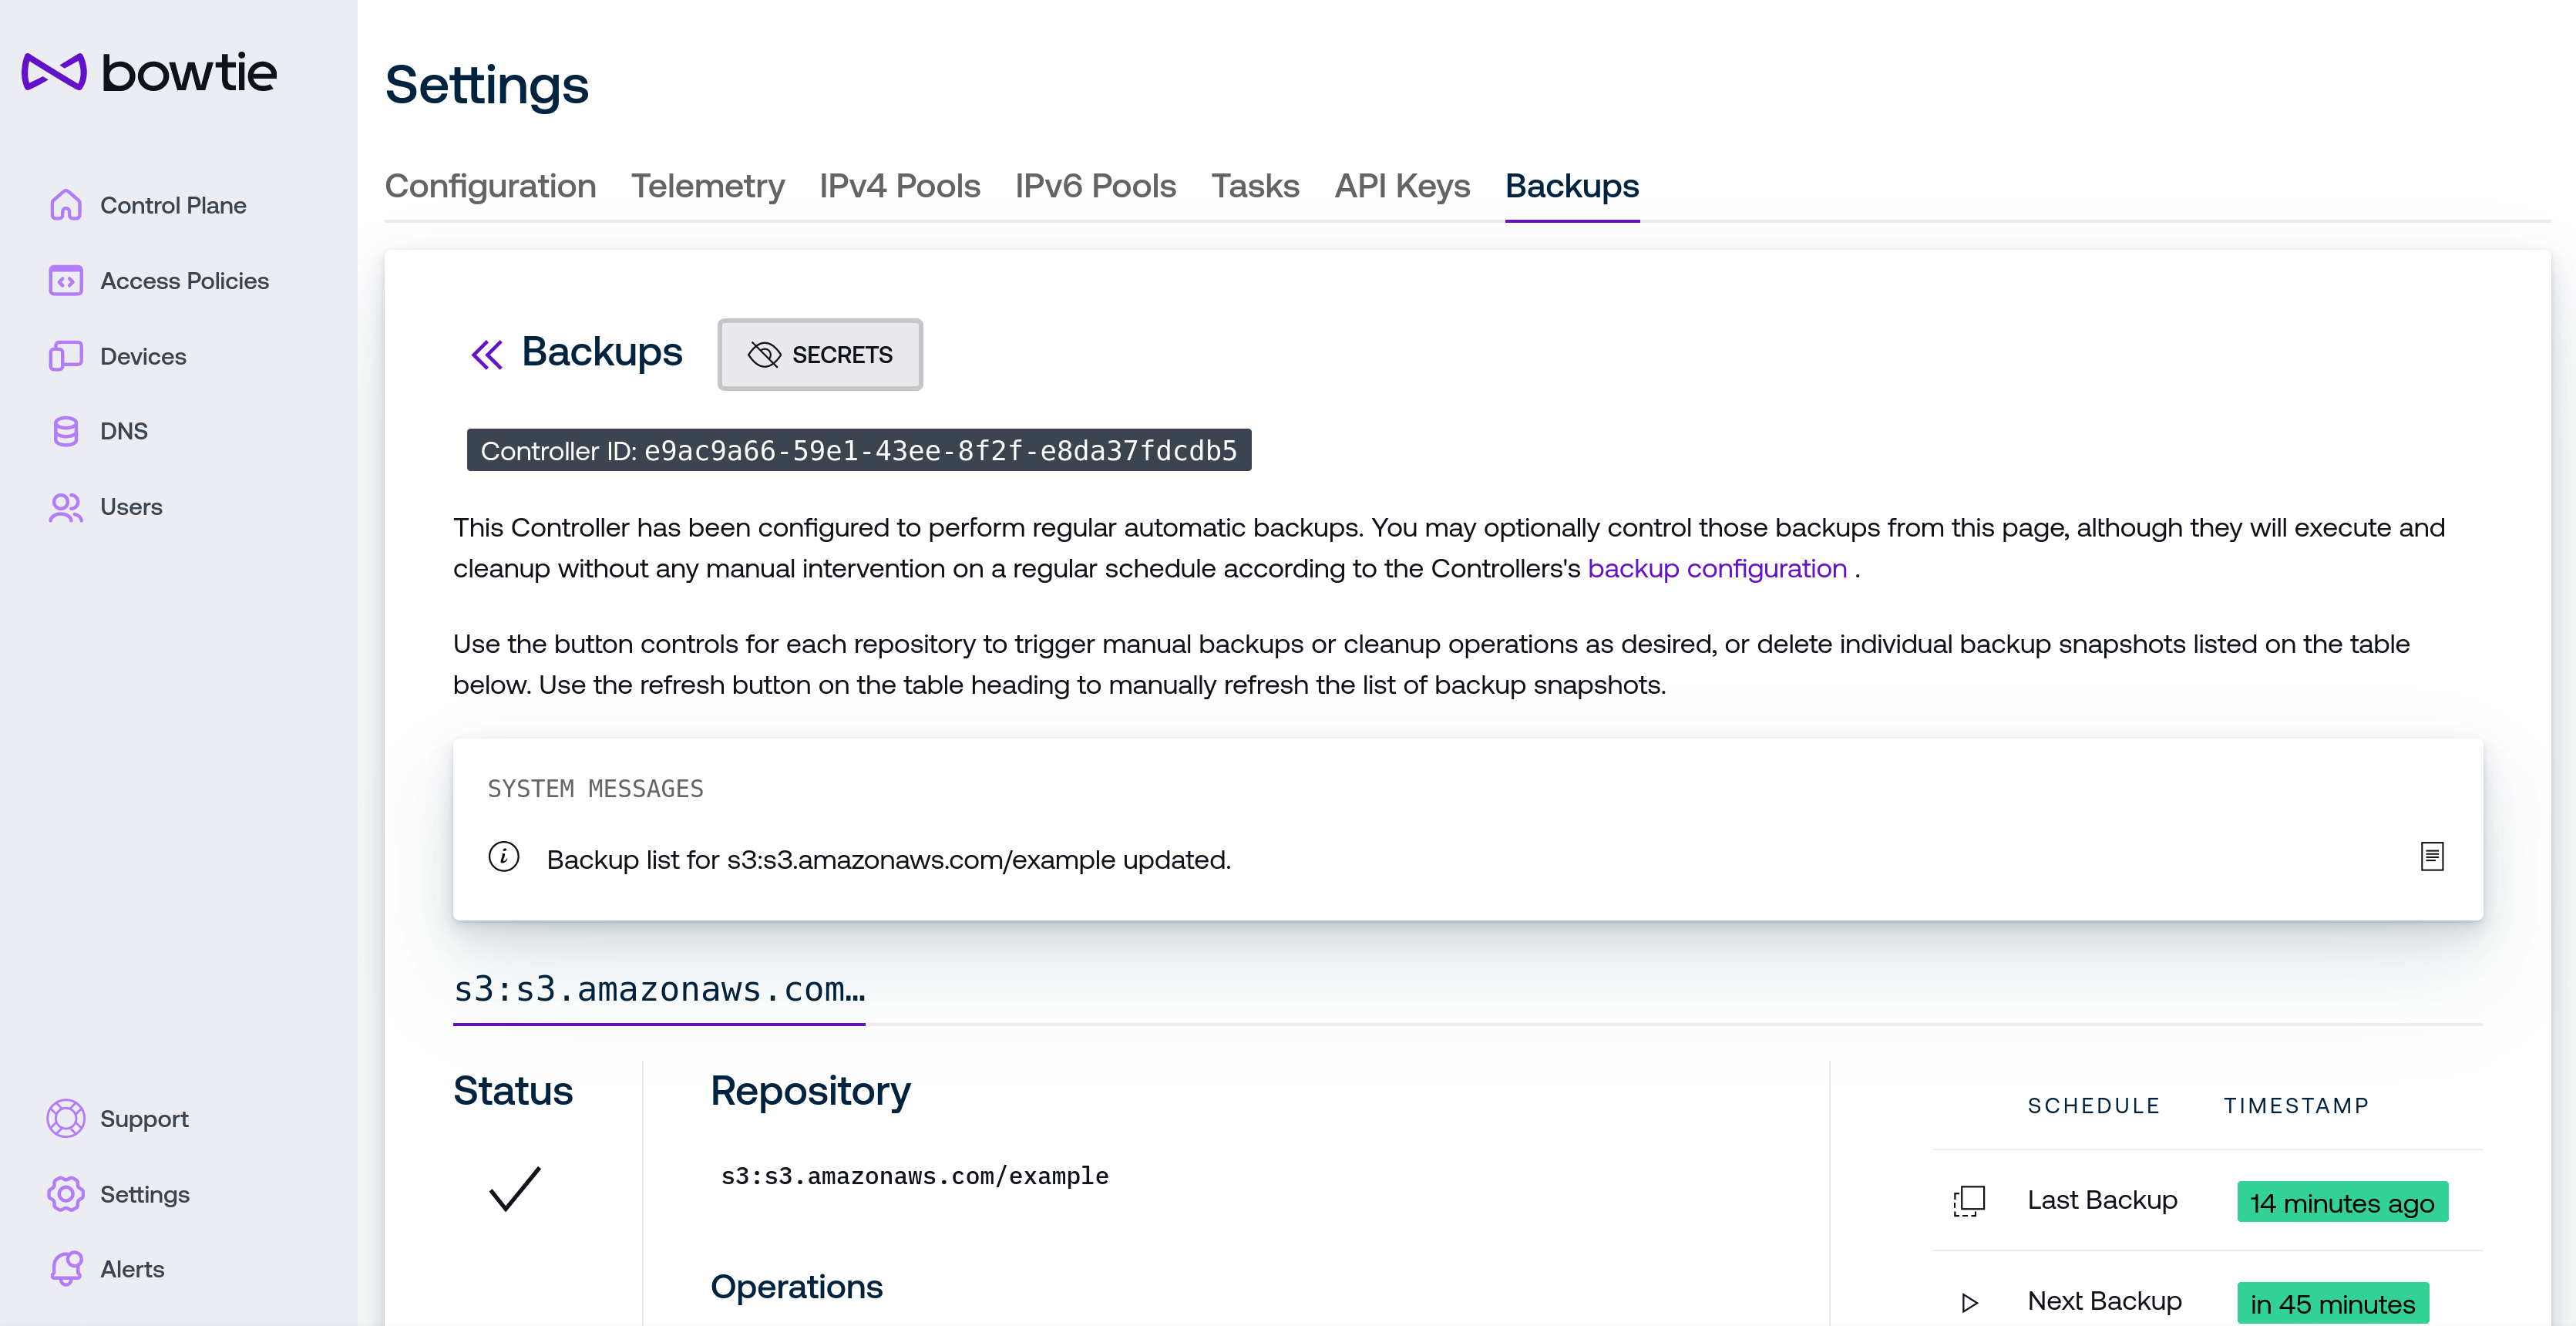
The Backups page permits more fine-grained control over backup operations. From this page, administrators can view backup activity, schedules, and status, as well as make backups, prune them, or delete individual backups and change backup secrets or API credentials. Use the back arrows next to the Backups heading to return to the backup strategies page for the Controller indicated in the Controller ID element beneath the header.
Per-Controller Backup Pages
Because backups are configured on individual Controllers and not cluster-wide, the information displayed on this page will reflect the backup configuration for the Controller that serves the browser request. For environments that operate individual Controllers behind distinct hostnames, this should always accurately reflect the backup configuration for the Controller in the current URL. If your environment operates Controllers behind a network abstraction like a load balancer that proxies to more than one Controller on the backend, requests may be served by any Controller. This page includes the Controller ID element to clarify which Controller the page is currently connected to.
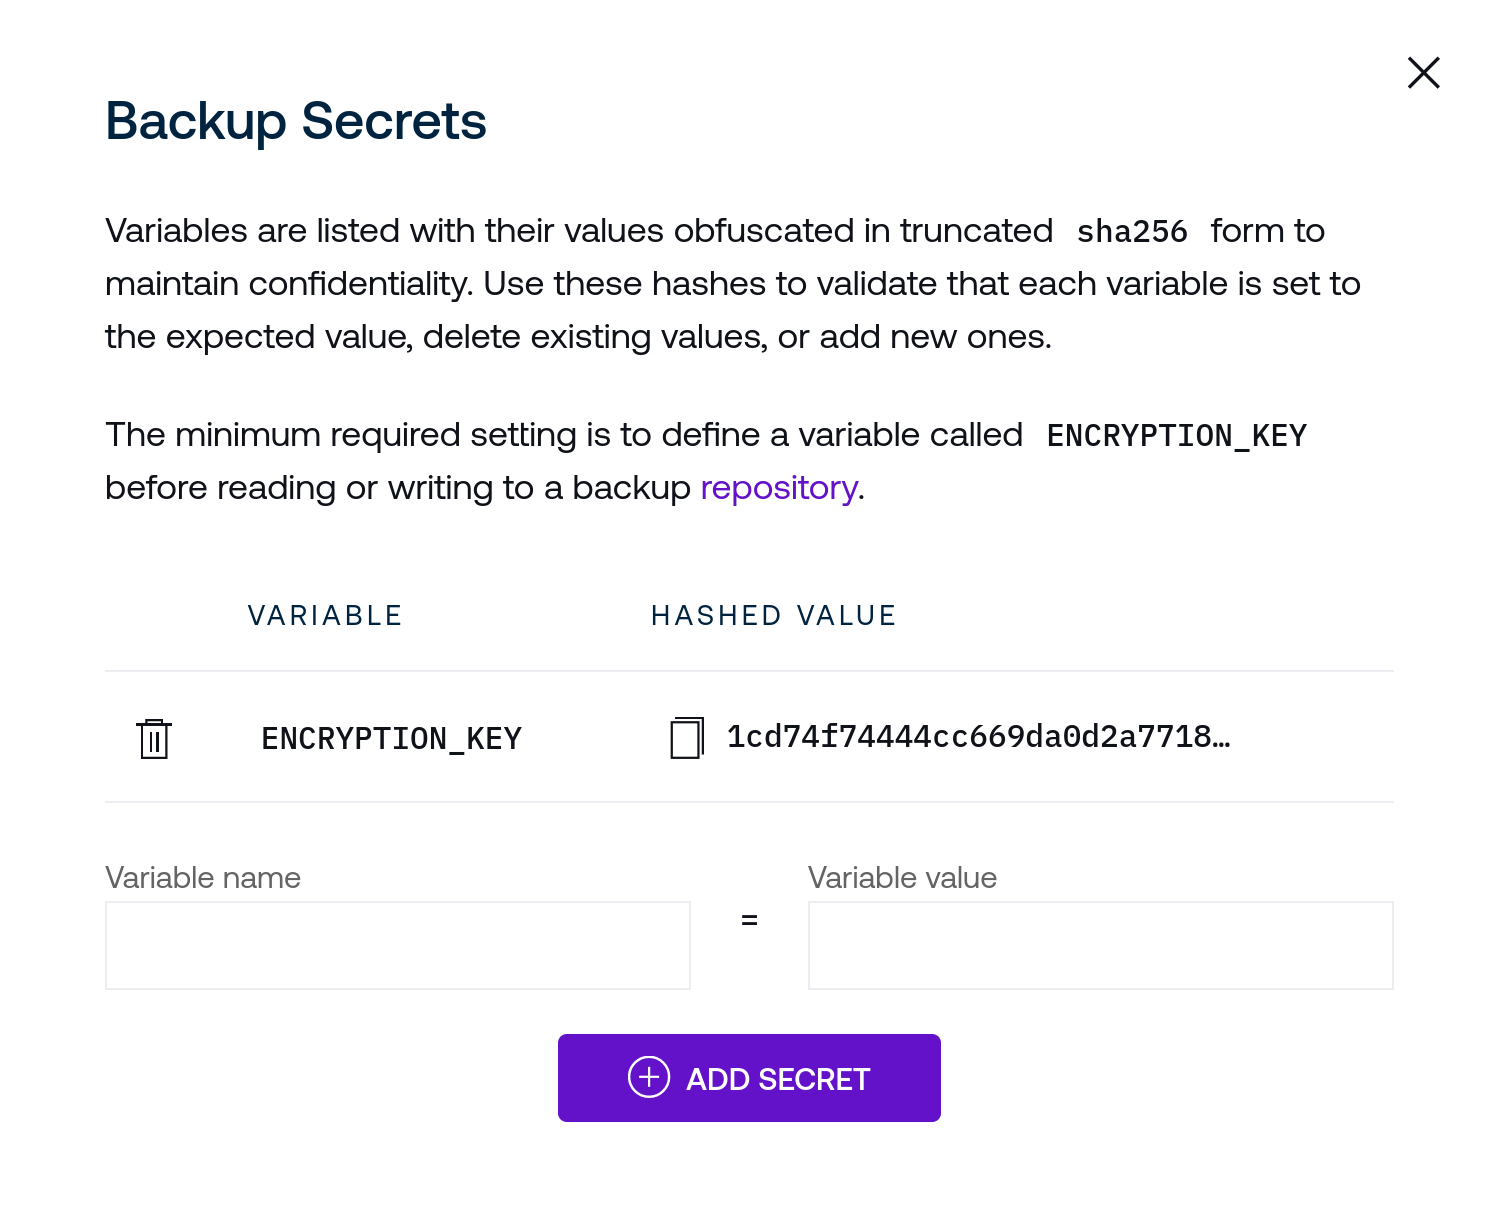
To the right of the Backups heading is a button that opens a dialogue that provides a user interface to optionally set backup encryption keys or credentials (for providers like S3) from the control plane interface. Secret values are obfuscated to avoid exposing these over the web interface. Secrets may be created or deleted from this interface.
Enter variable names in the left input field and values for these variables in the right text input field and submit them with the Add Secret button.
The backend will accept these values without a need to restart.
For example, a functioning backup system that stores backups in S3 (without use of instance roles) would require, at a minimum, values set for ENCRYPTION_KEY (to encrypt backups) and AWS_ACCESS_KEY_ID as well as AWS_SECRET_ACCESS_KEY for remote authentication against S3.
Use the trash can icons to delete secrets.
While this page serves as a way to securely manage values like API tokens, you may enter any environment variables that you may need to properly configure a repository endpoint, such as changing the AWS region (see the supported restic environment variables for a complete list). Alternatively, you may choose to define these and other configuration values via the methods outlined in Backup Settings.
The System Messages box will update to reflect any outbound messages from the Controller regarding backup activity. Beneath this box you may select one of your configured backup repositories to view its status and available controls.
Above the table of backup snapshots are fields with the repository’s current status:
Status will update to reflect whether a backup is occurring, backups are being pruned against the configured retention scheme, or a backup is being deleted. When the Controller is awaiting the next scheduled backup operation without issues, a pulsing green check mark will be present.
Repository reflects the full name of the given backup repository.
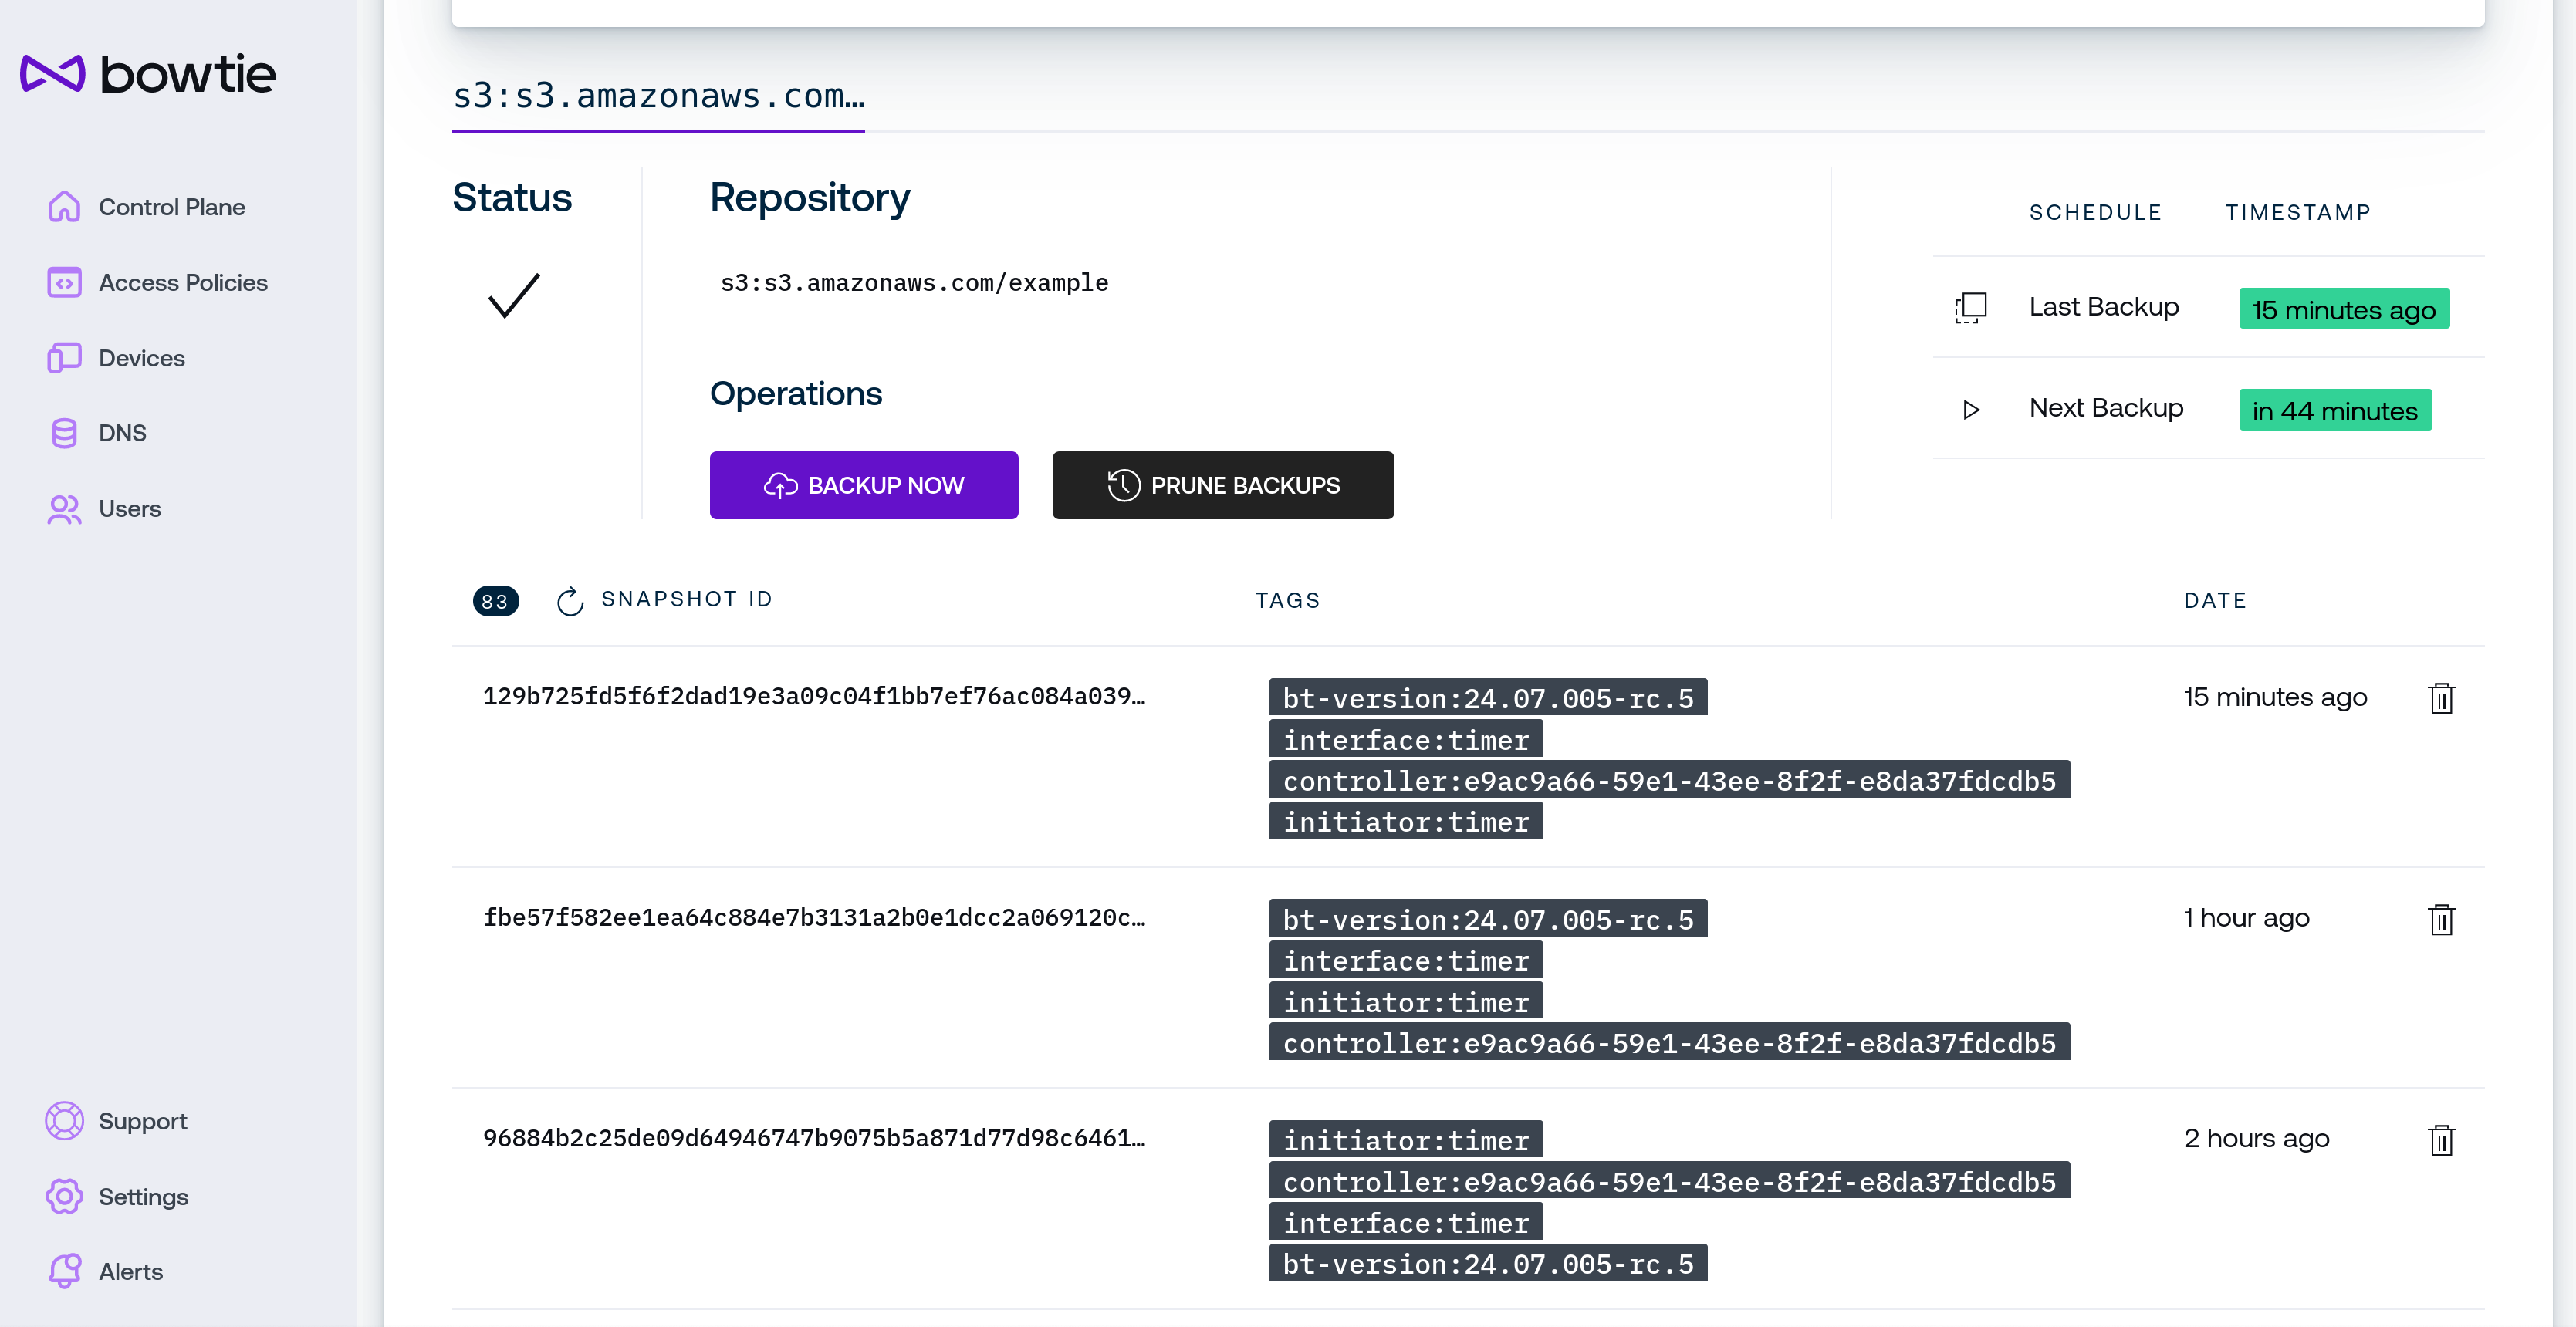
Operations permit an administrator to manually invoke backup activity ahead of the next scheduled execution:
Use the Backup Now button to immediately take a new backup snapshot. The next scheduled backup will remain unaffected.
Use the Prune Backups button to immediately clean up old backups against the backup retention scheme configured on the Controller’s backup strategy.
The table with listed schedules indicates when the last backup operation ran and when the next backup operation is scheduled to run.
The table beneath the repository’s controls lists all snapshots present in the repository. Use the refresh icon in the table heading for force-refresh the snapshot list if desired. To forcibly remove a specific snapshot without adhering to the retention schedule, use the trash can icon next to the desired snapshot to wish to delete.
Messages and Notifications
Controllers record all update activity which can be viewed alongside upstream release notes on the System Messages page, which is only viewable for users with control plane privileges.
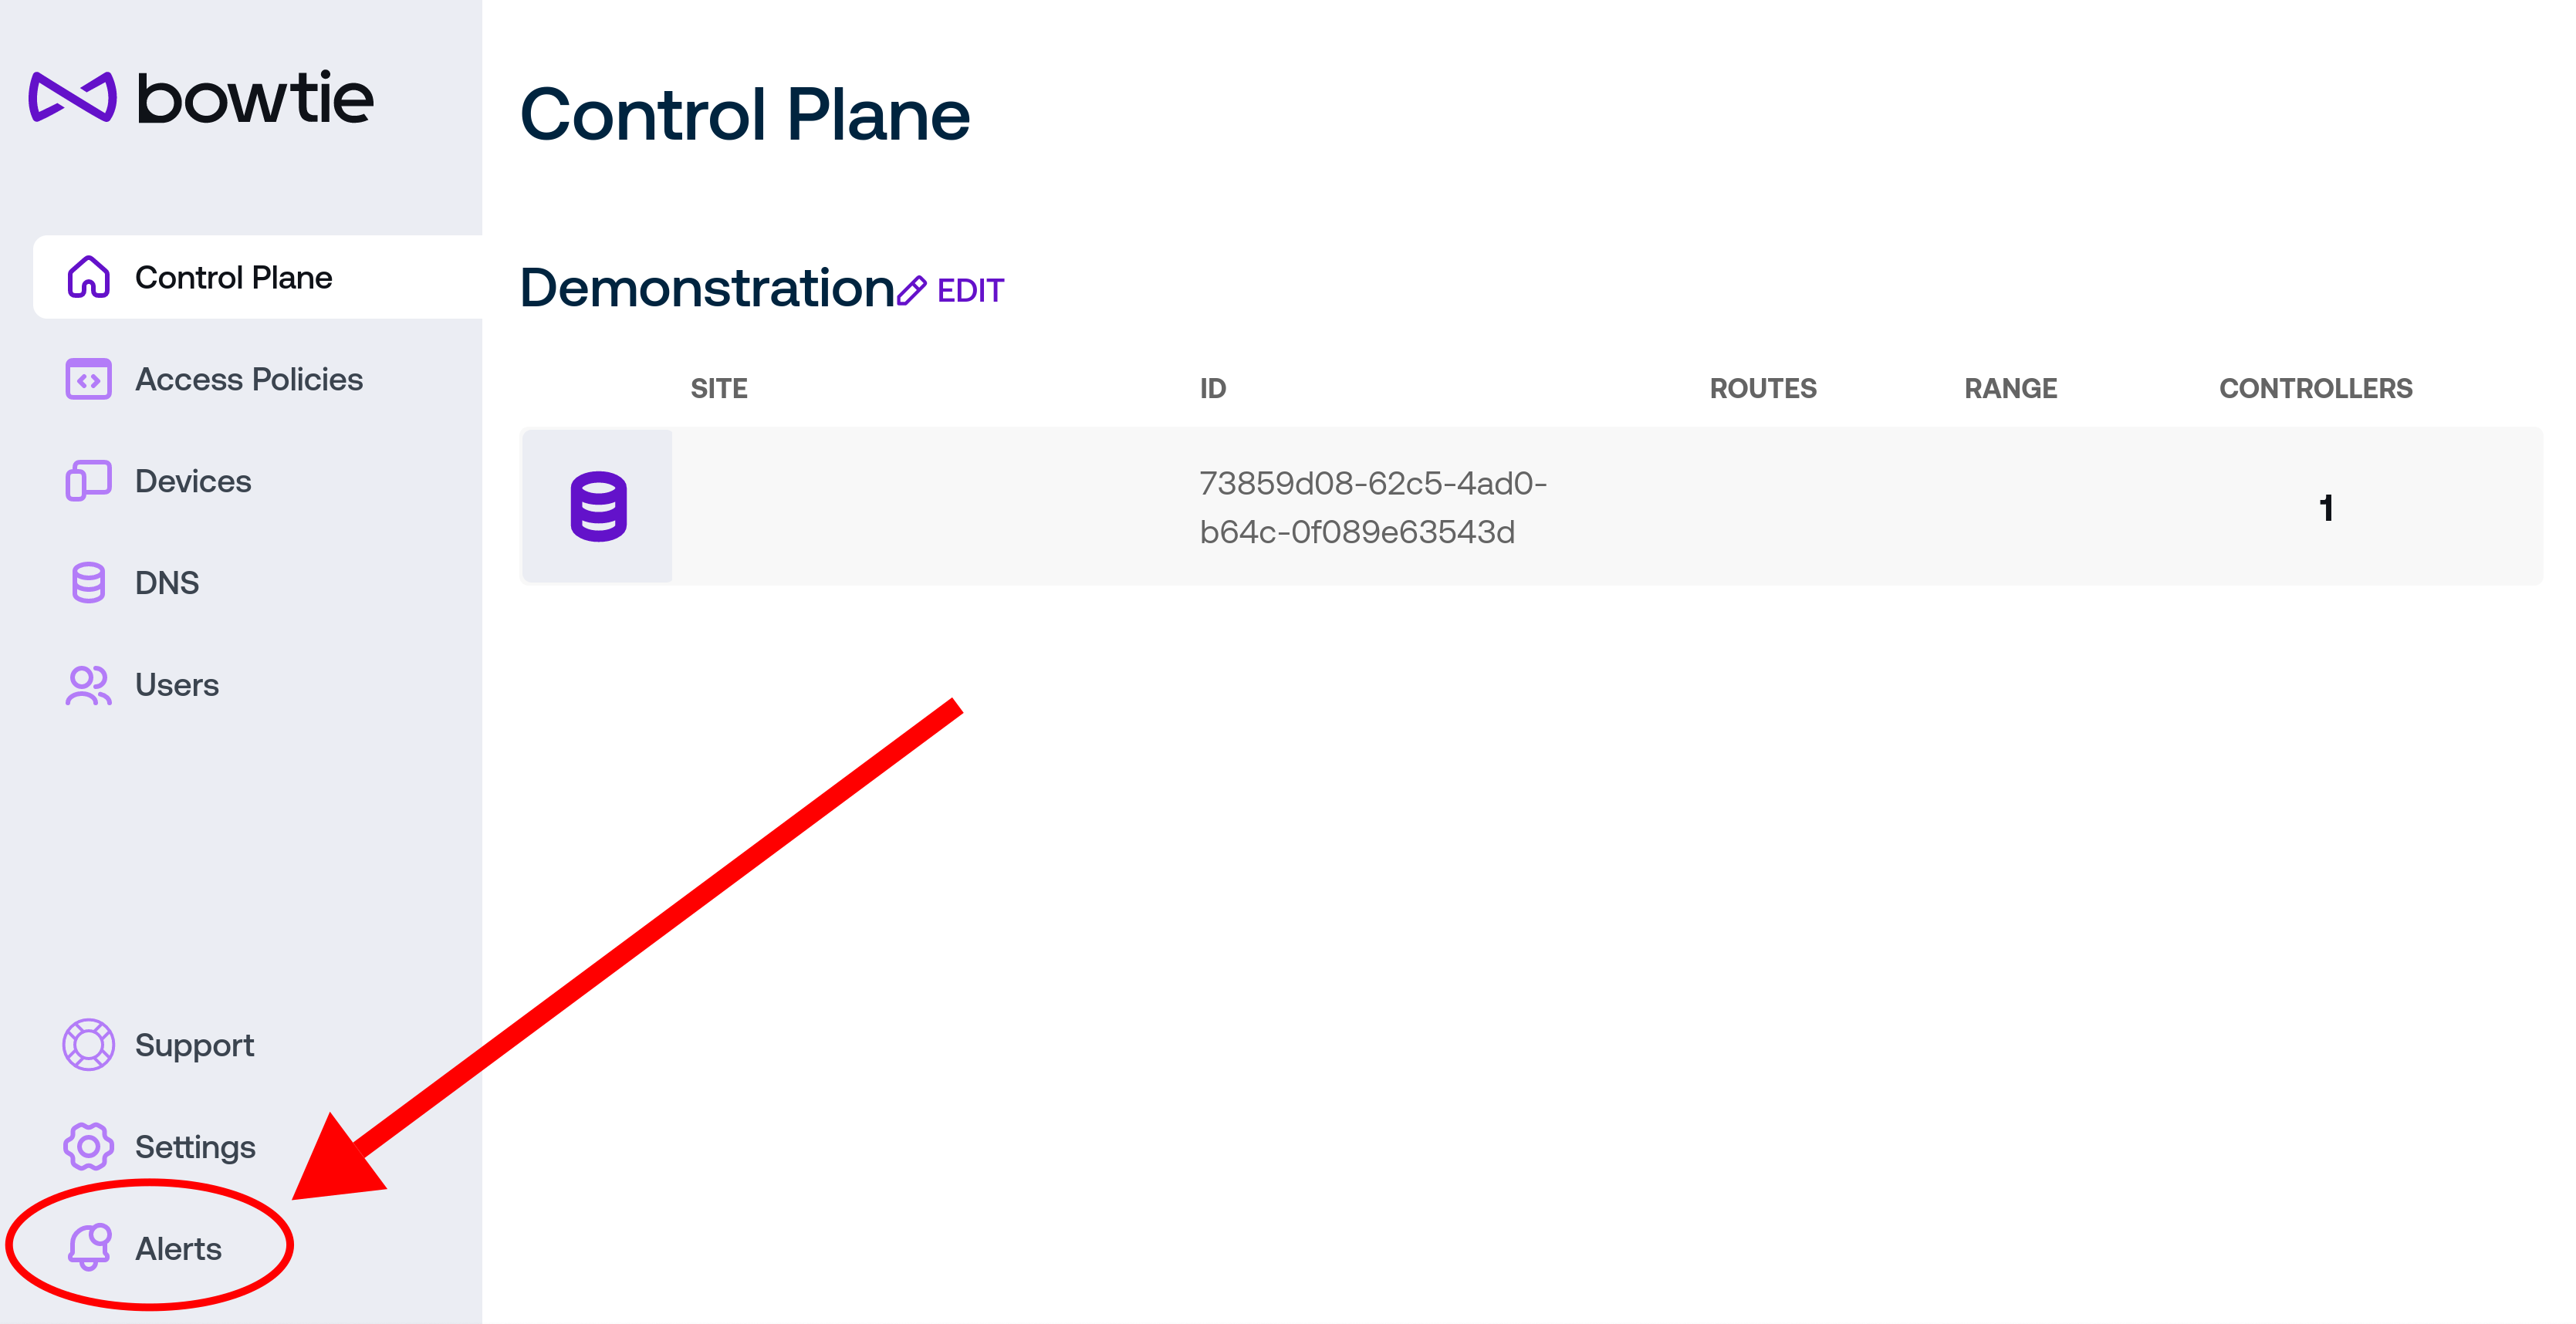
Click on the feed icon to view the messages page, which is separated between Controller Events like system updates and Releases which is drawn from upstream release notes
Events
The Events page displays activity like system updates. Whenever a Controller updates its version, that event will be recorded for later reference here.
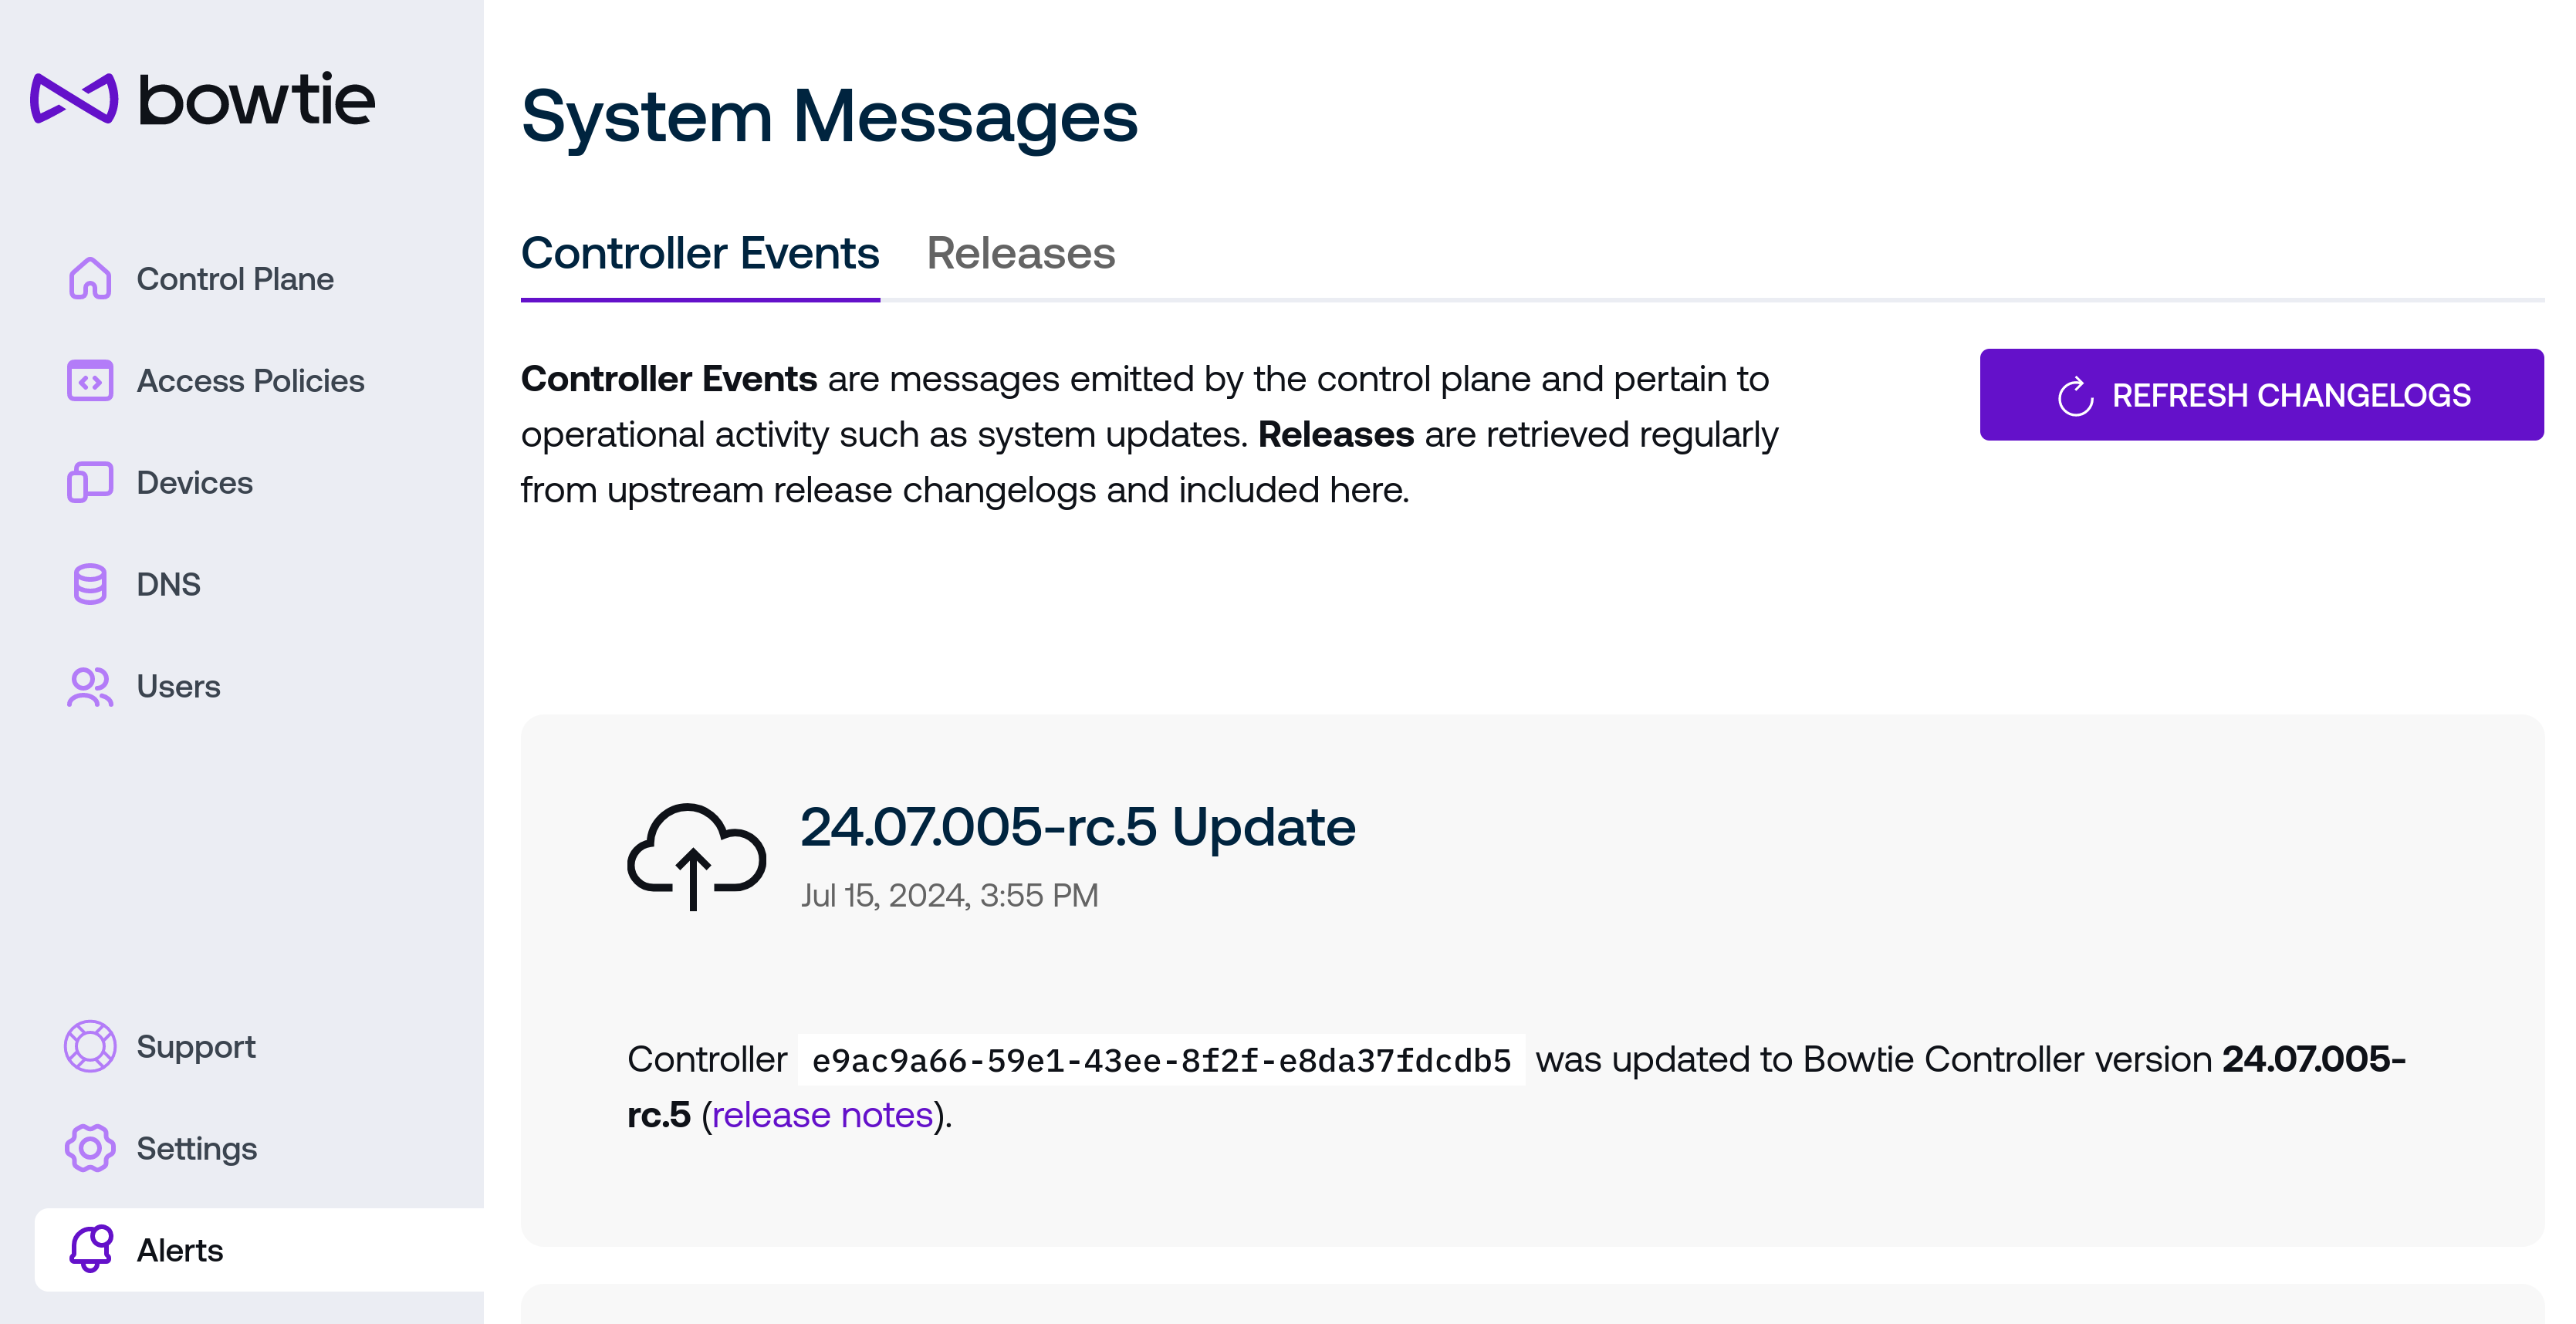
In addition, some updates may move Controllers to versions that include noteworthy changes that should be reviewed by operators. In cases like these, update events will include links to their associated release note changelogs for review by administrators.
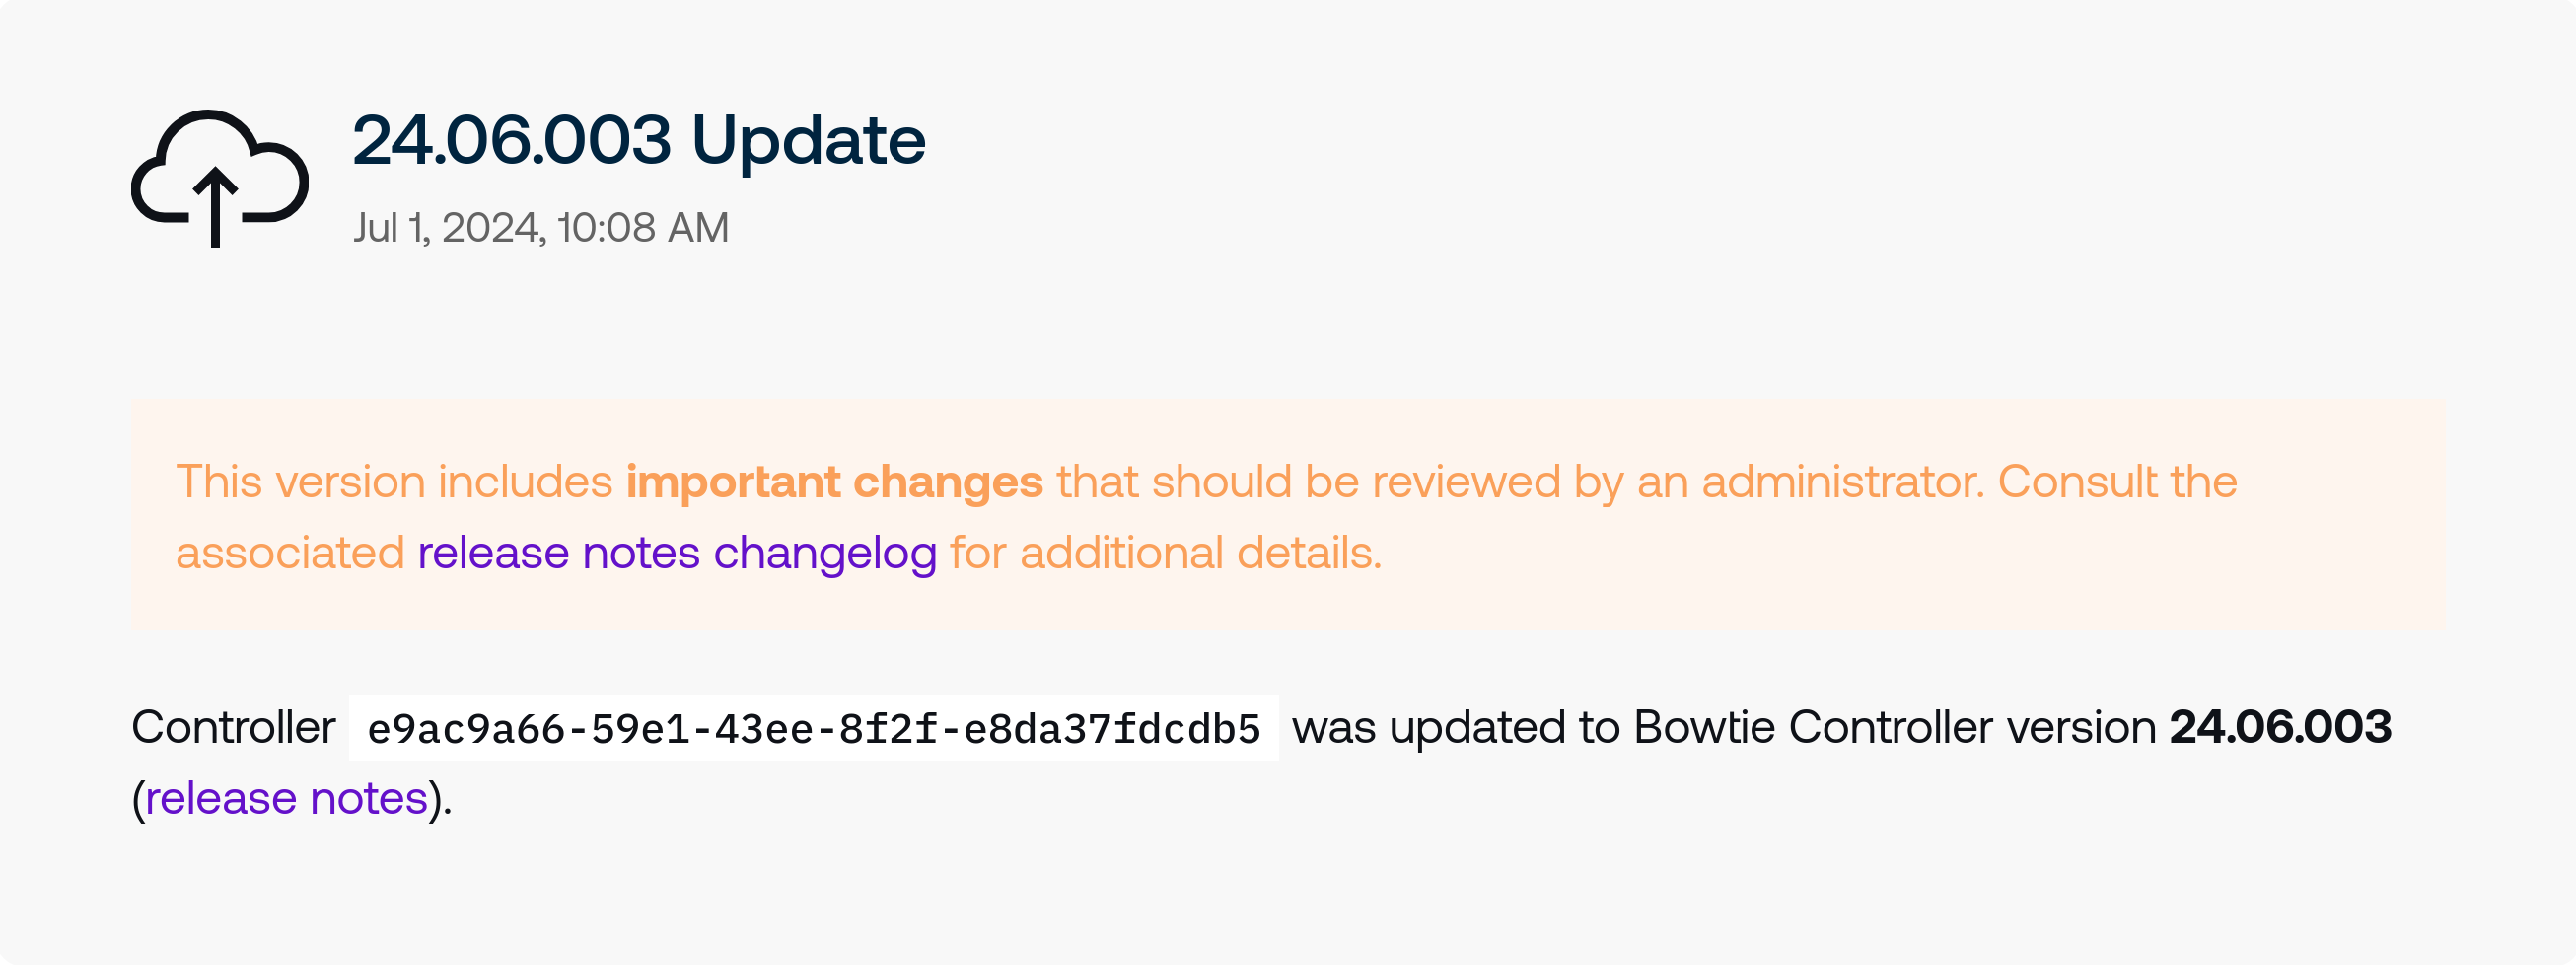
Click the changelog link to be taken to the associated version release notes.
Release Notes
Select the Releases tab from the Messages and Notifications page to view release notes for all versions.
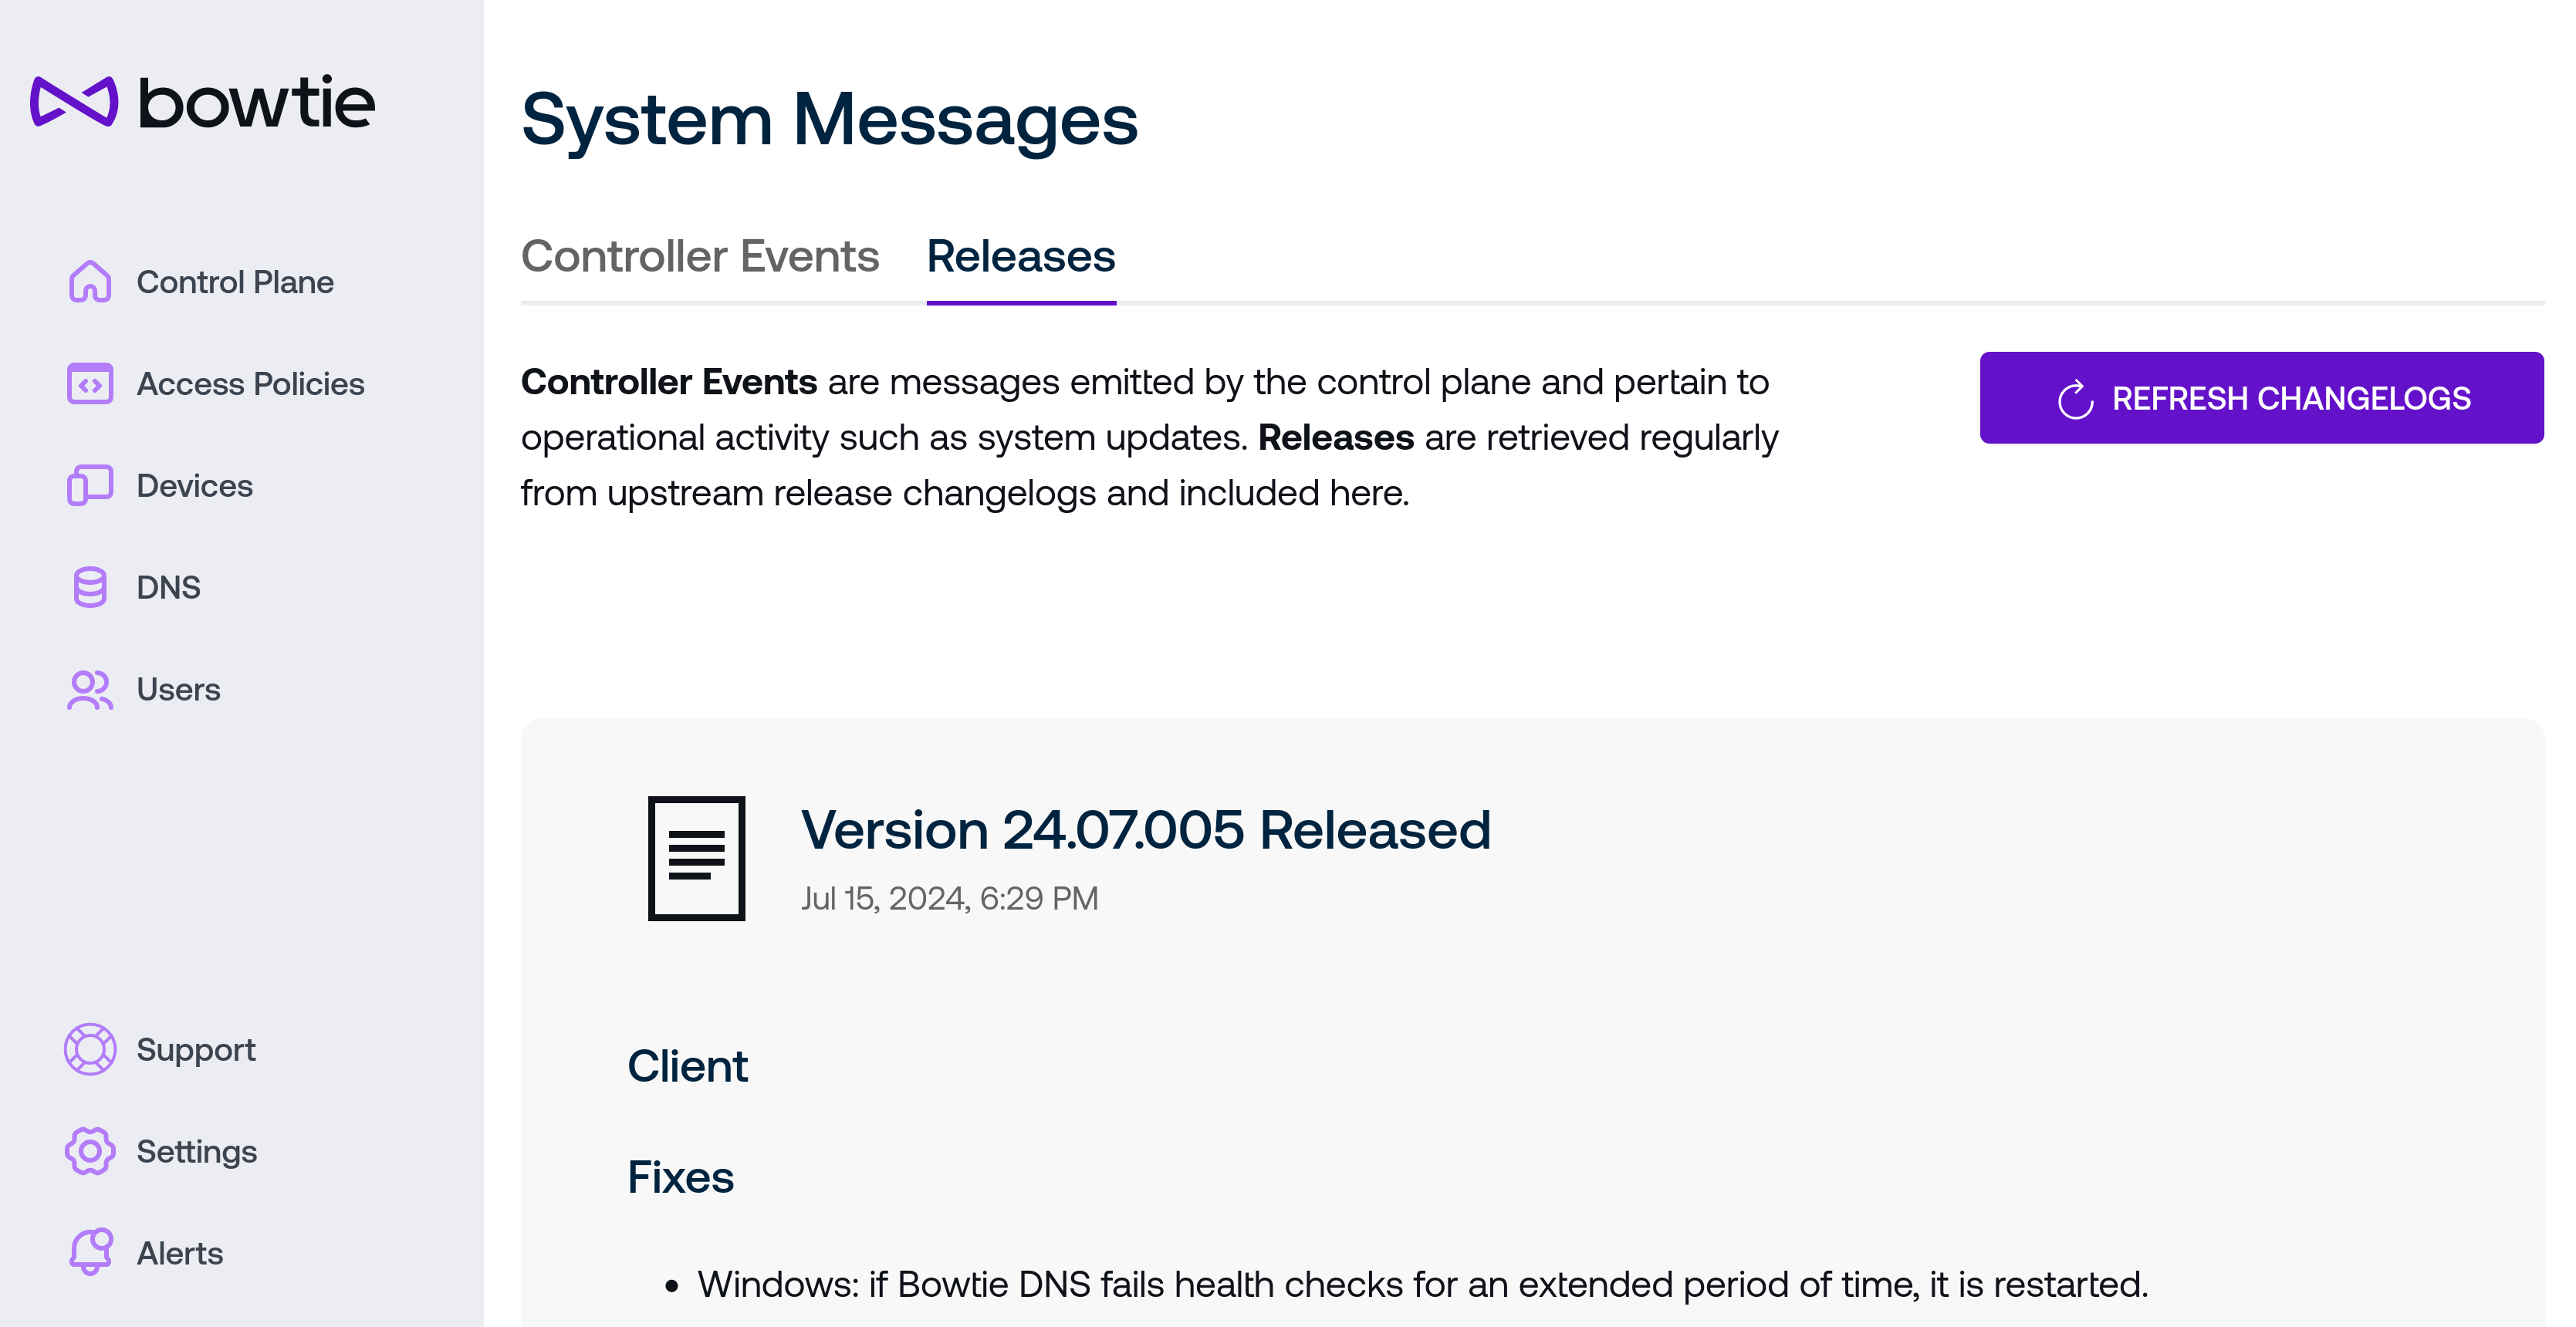
This feed is included as a convenience to view update activity alongside changelogs - upstream release notes are also available on the Bowtie documentation site or as Atom and RSS feeds.
Support Pages
The lifesaver icon in the upper-right navigation bar of the control plane web interface will bring you to the Support section.
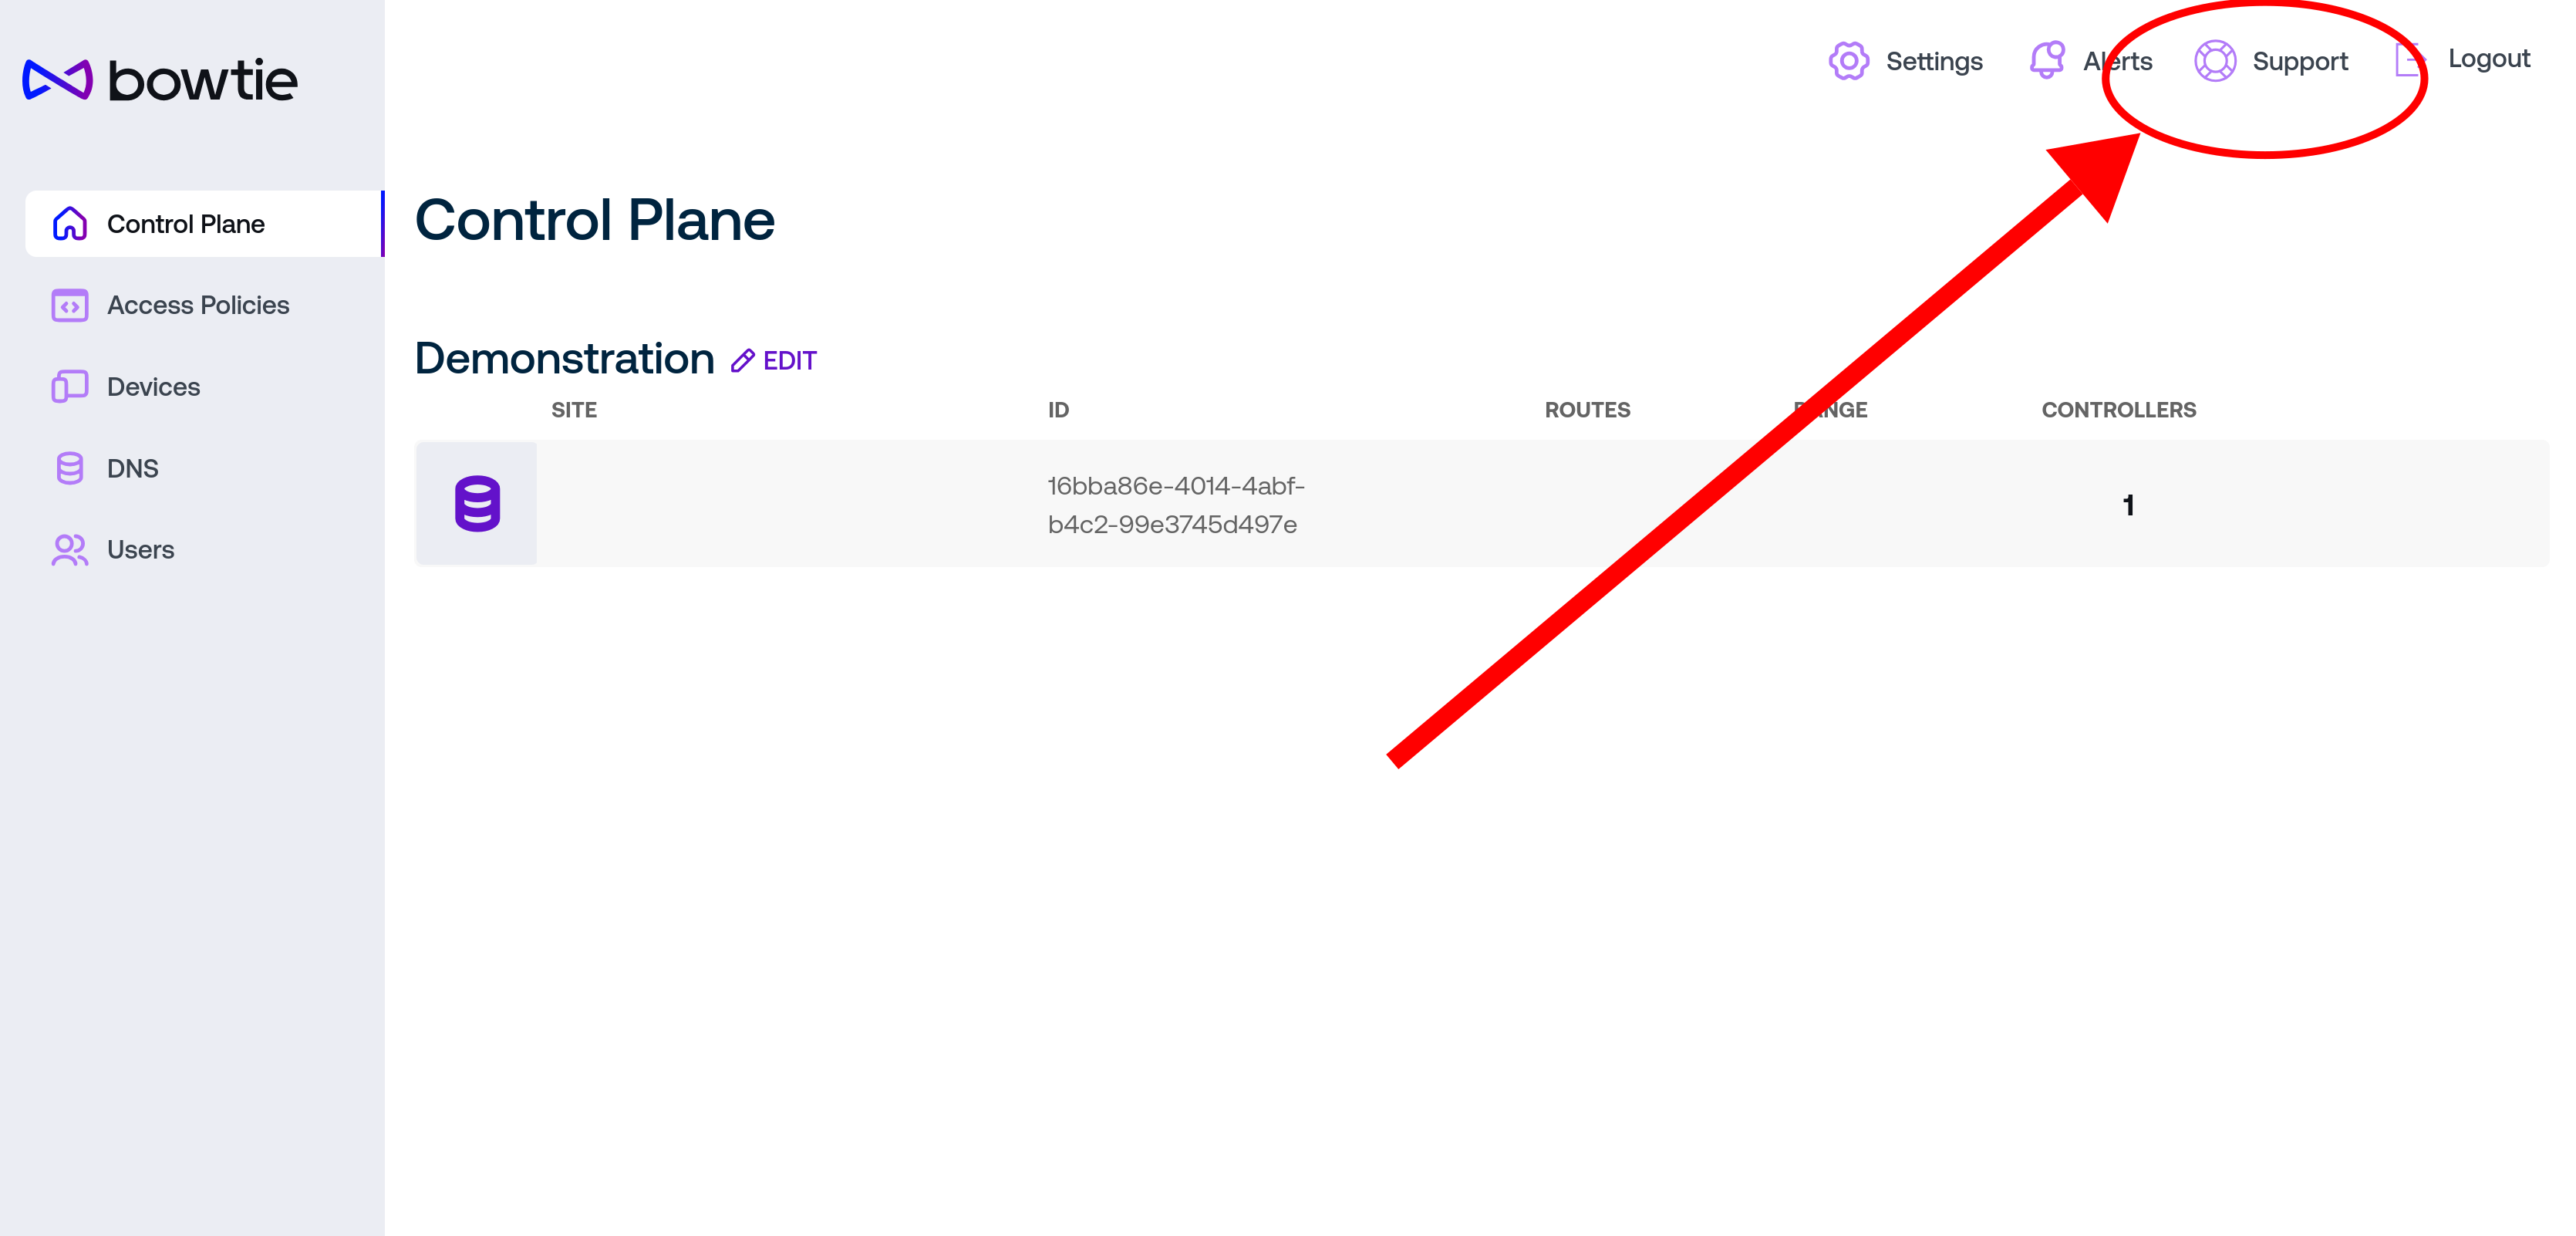
At time of writing, the following support pages are available:
Assisted Support (SoS)
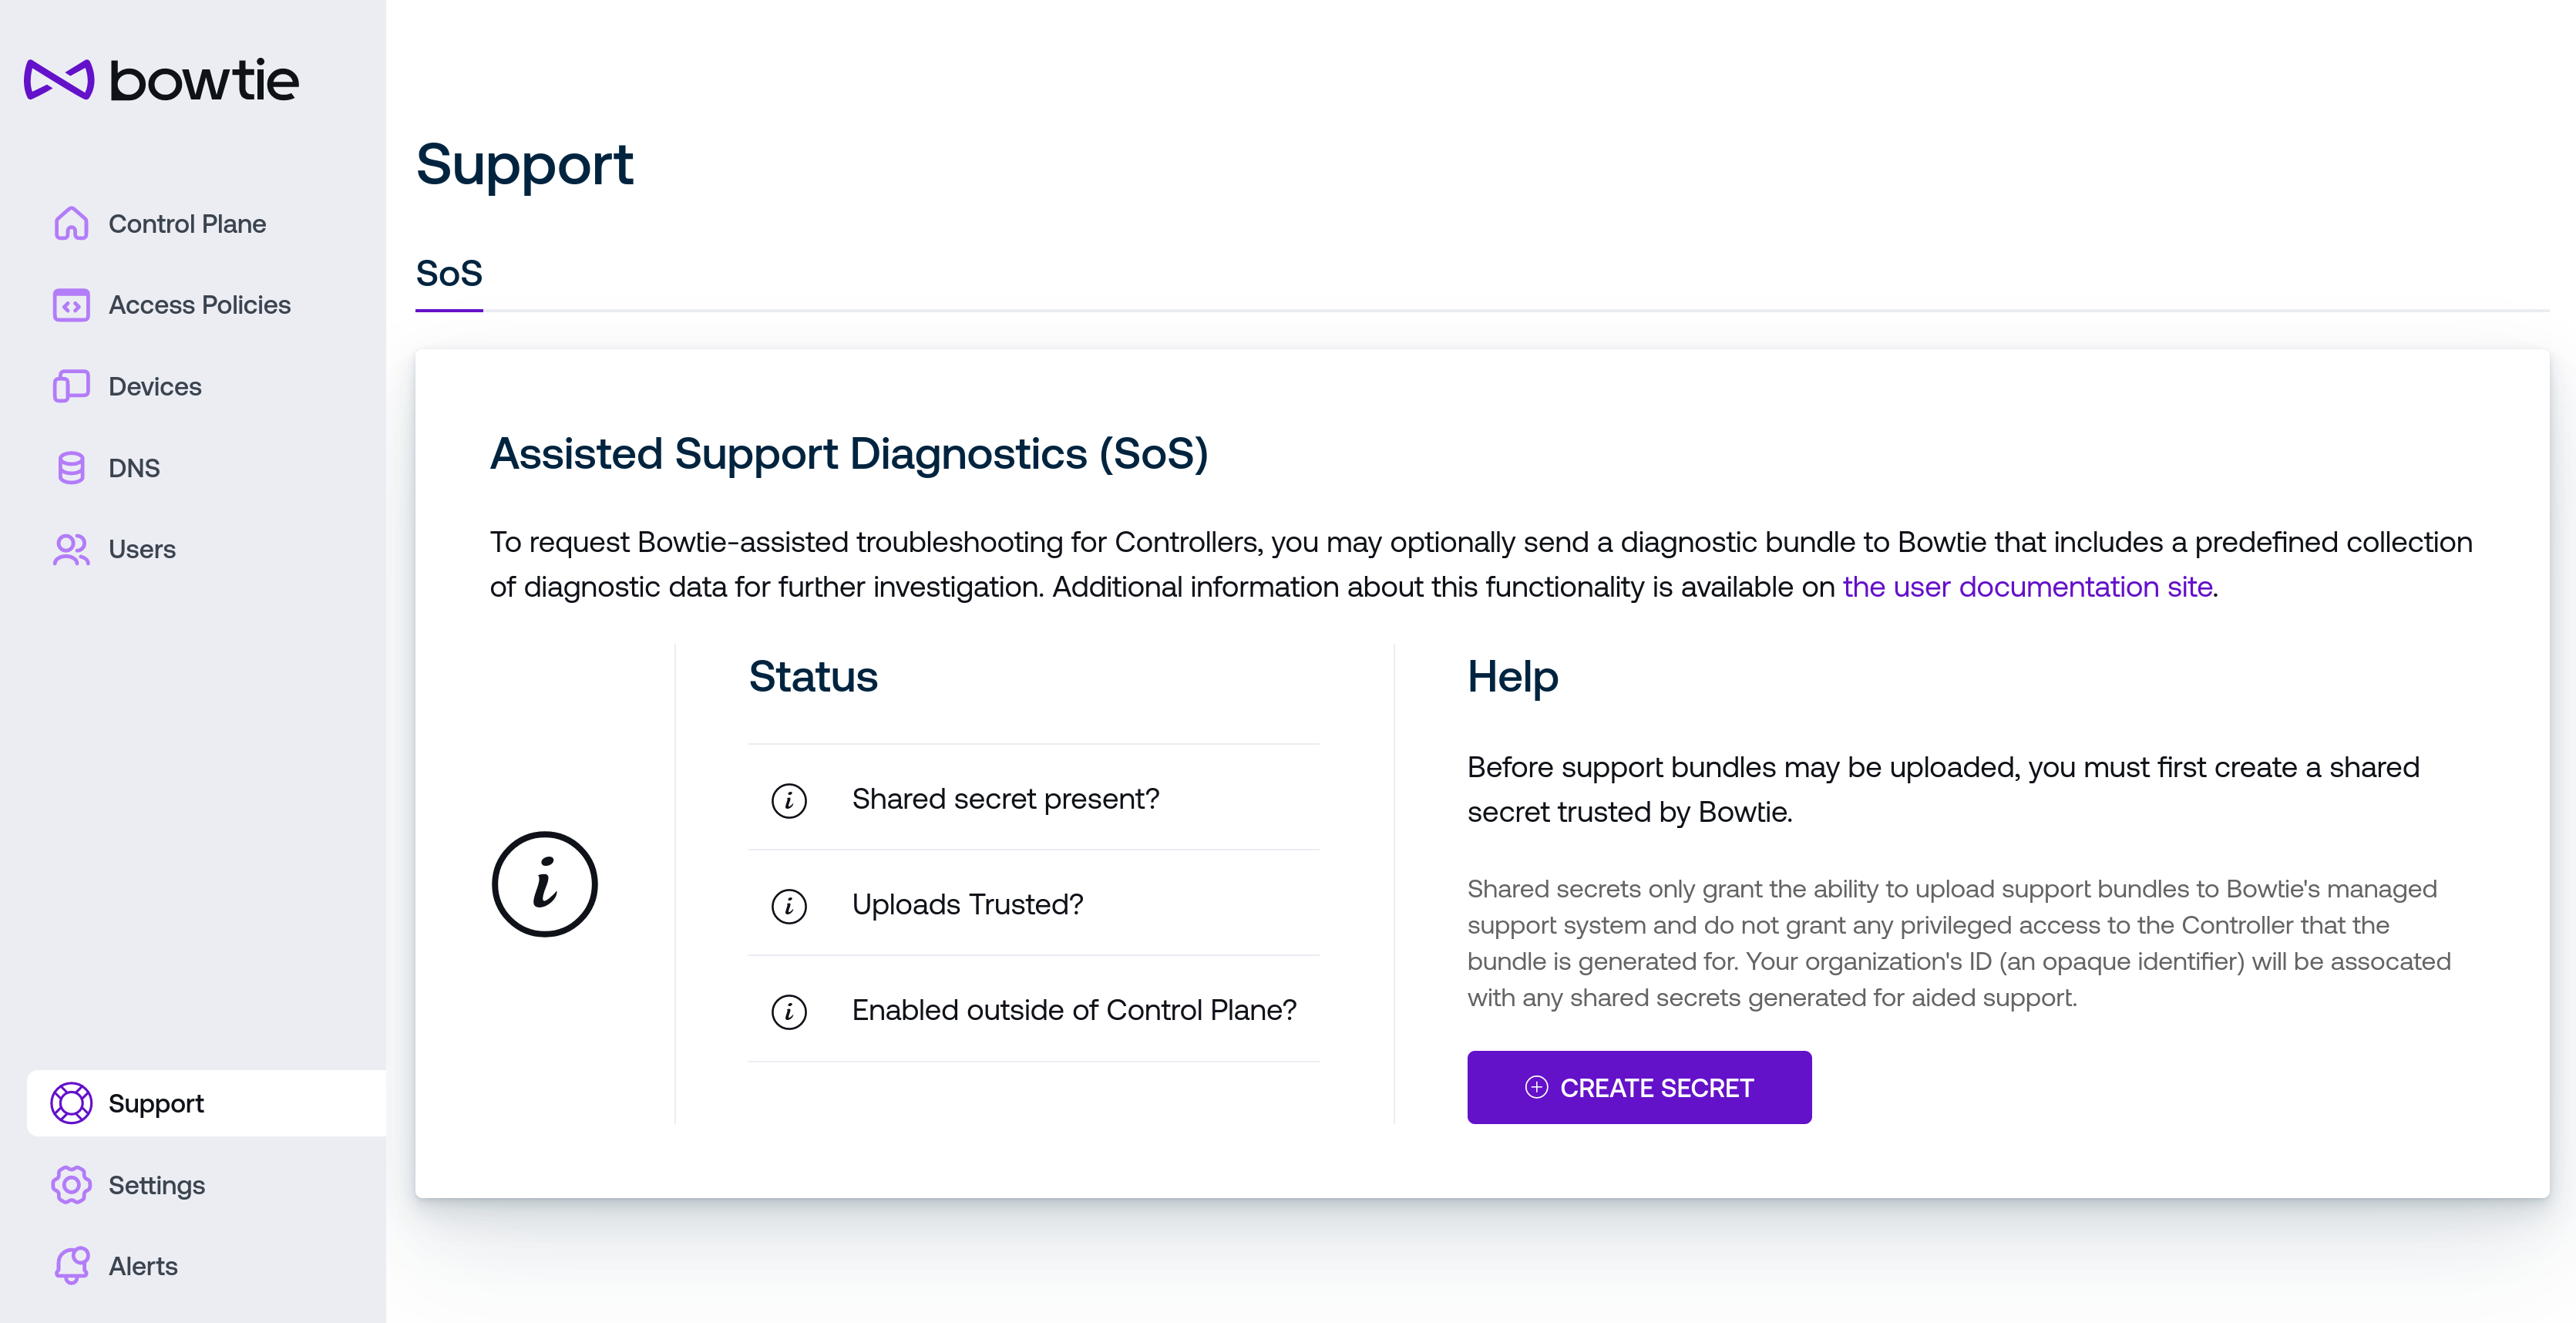
The control plane assisted support (or SoS) page is the administrative counterpart to the troubleshooting SoS section but integrated directly to the control plane web interface. If the web interface for the Controller is functional, this method offers a more convenient alternative to the other, more manual methods that provide assisted support without the assumption that the Control Plane is functioning. If your Control Plane interface is non-functional, use the approach described at Controller SoS. Otherwise, you may use the interface described here.
Only users with sufficient administrative privileges are granted the ability to generate support bundles. The process to send a support bundle to Bowtie follows this sequence:
First, a shared secret must be established between the Controller and Bowtie. Use the Create Secret button to generate this shared secret, which is stored on the Controller. The Status section should update to reflect that a shared secret has been established but must still be trusted by Bowtie.
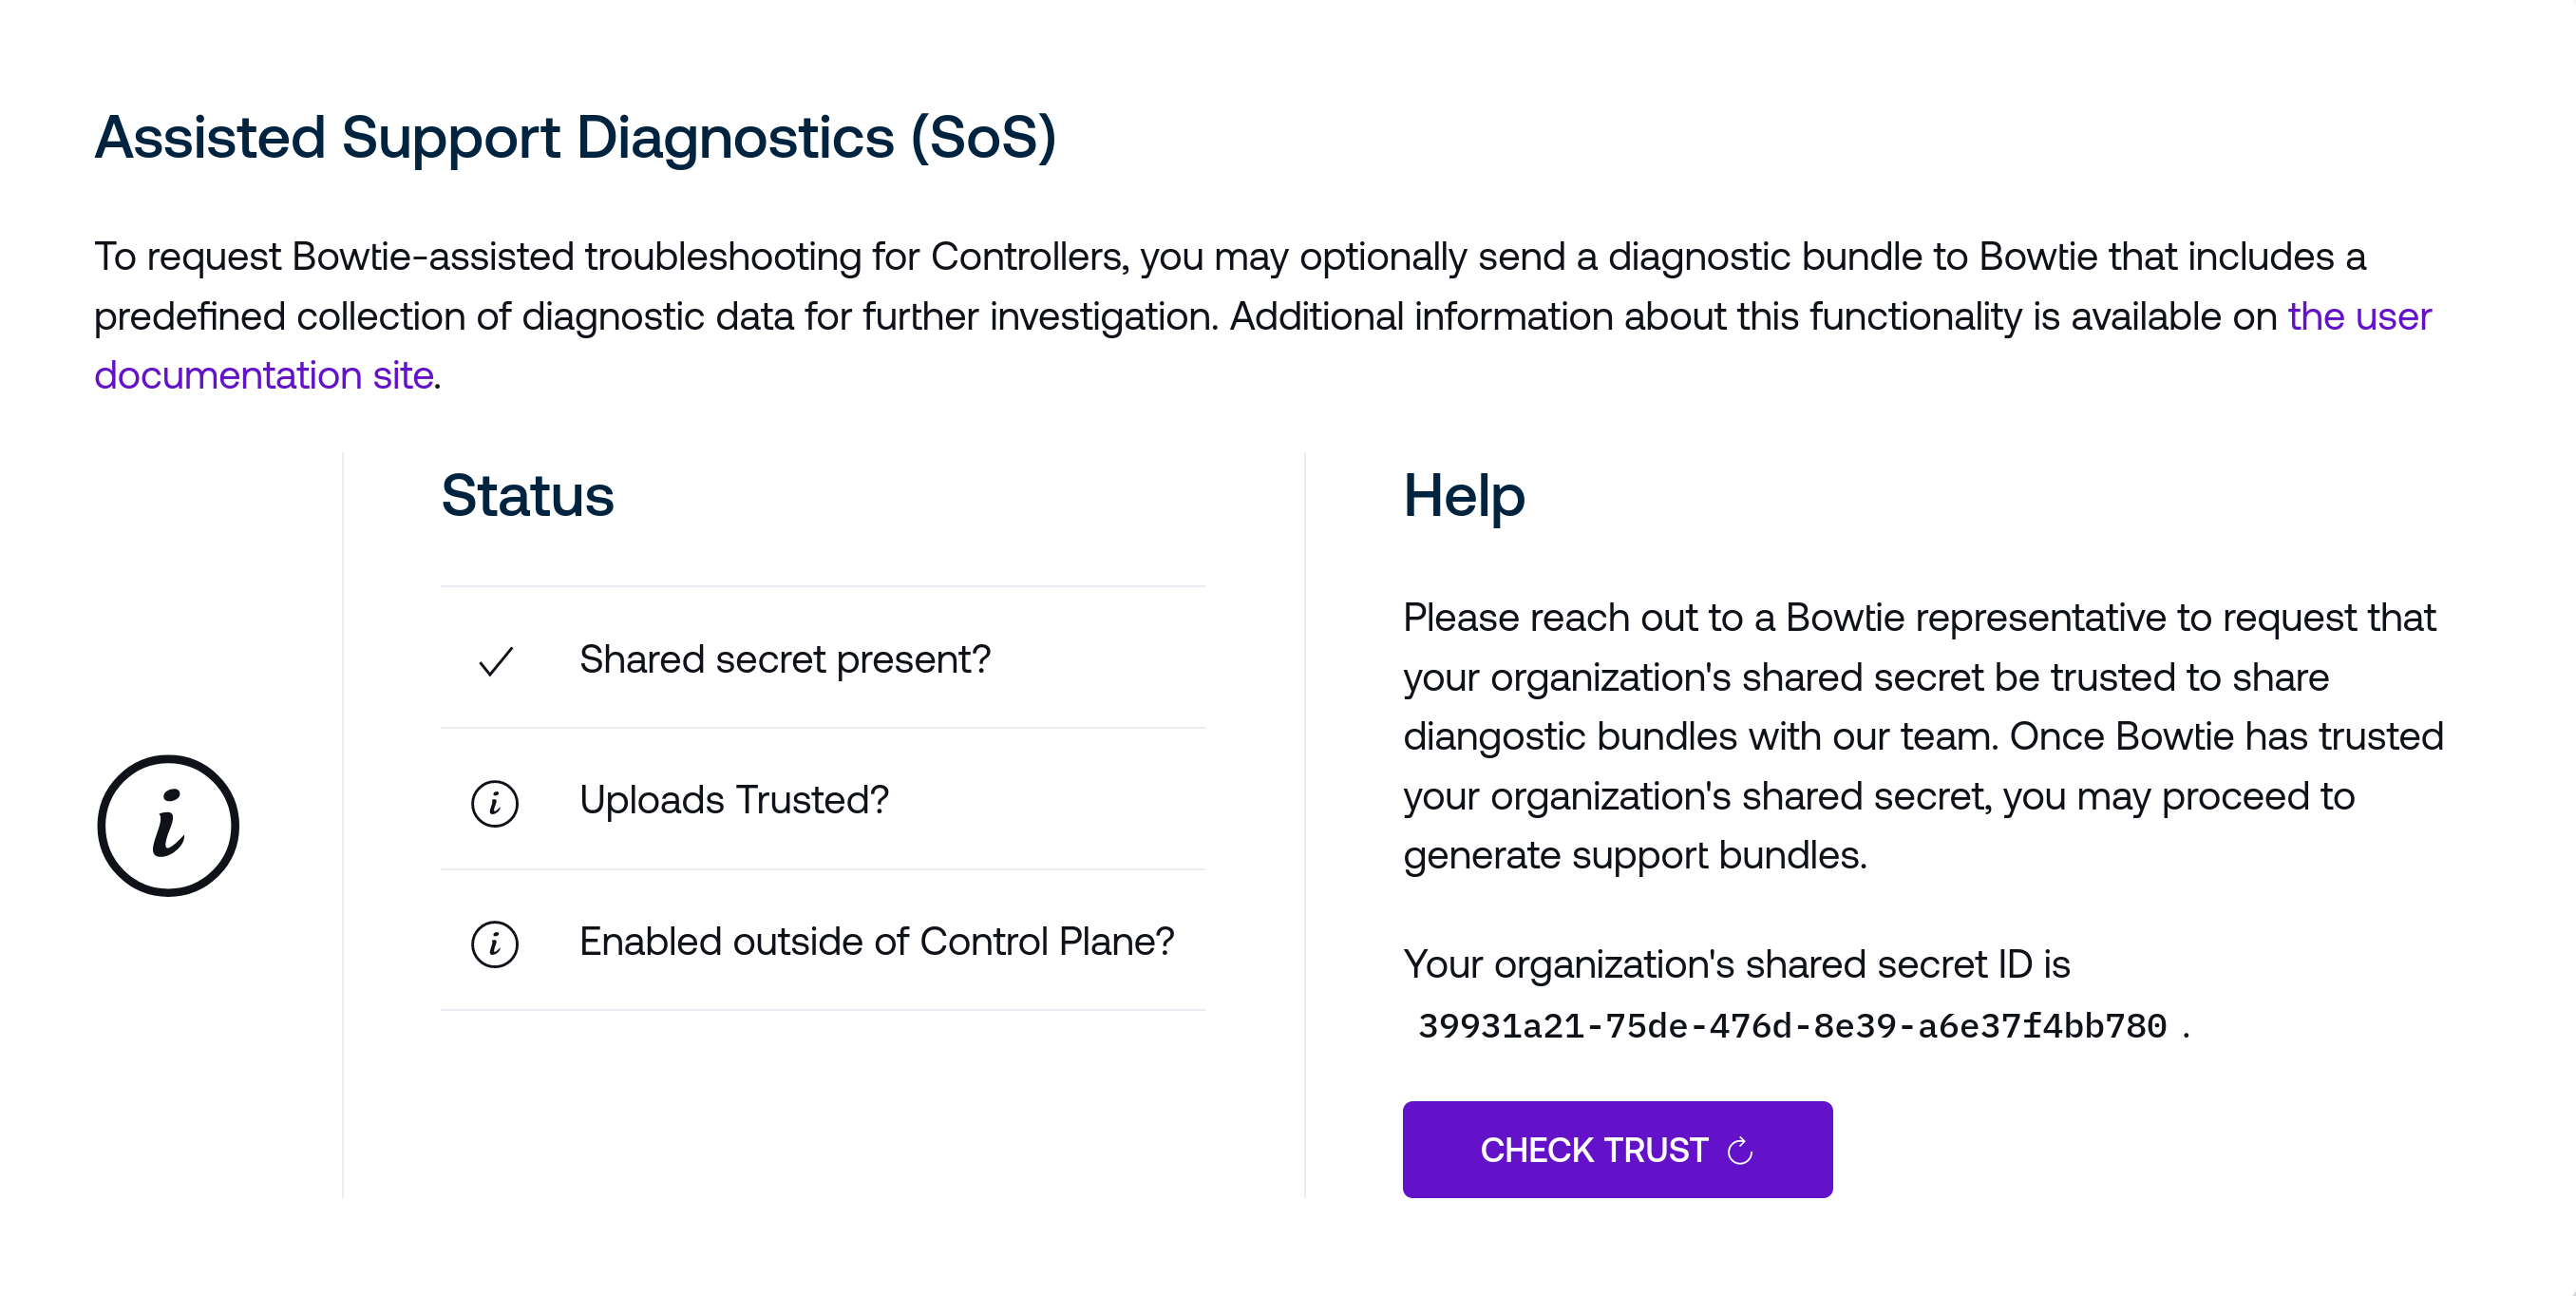
Next, reach out to a Bowtie representative with the shared secret ID to request that the shared secret be trusted by Bowtie. After doing so, you may use the Check Trust button to re-check the validity of the shared secret to proceed.
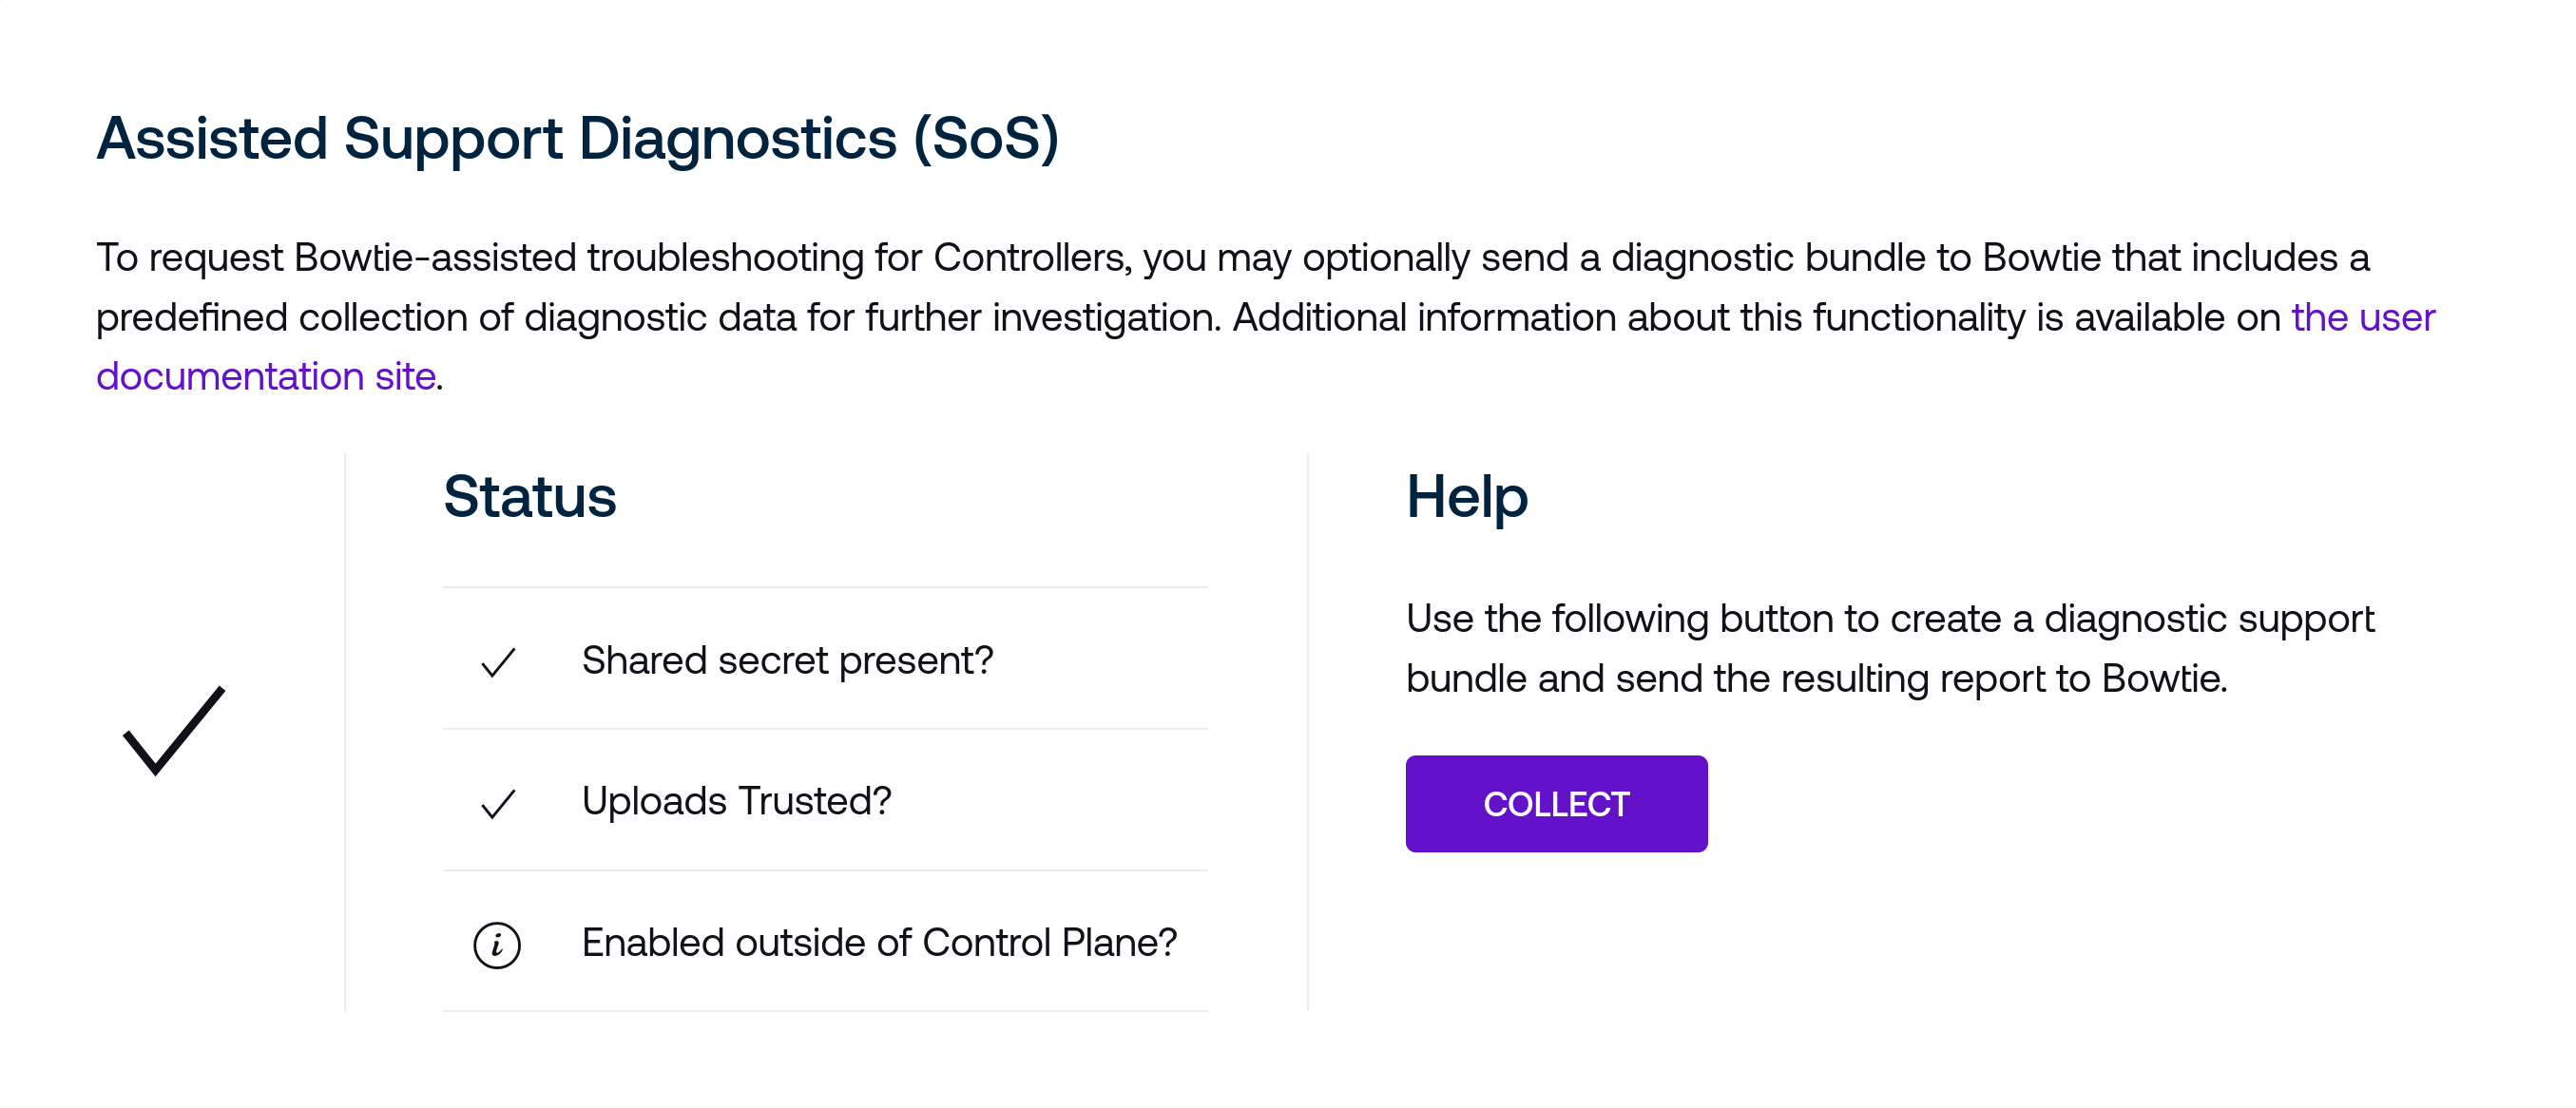
At this point your Controller is prepared to collect and deliver diagnostic bundles to Bowtie. Use the Collect button to aggregate a diagnostics bundle and deliver it to Bowtie. Optionally, you may open the dropdown menu above the Collect button to select additional Controllers that will also assemble and submit support bundles. They will use the shared secret provisioned in the previous steps. After completing, the page will update to display the bundle ID:

Provide this support bundle ID with a Bowtie representative who can assist with further troubleshooting.
SoS Outside of the Control Plane
The final field of the Status section indicates whether the SoS process has been initiated from outside of the Assisted Support (SoS) page via the Controller SoS process. If this field indicates that SoS generation has been validated and enabled but you have not initiated the serial console-based process listed in Assisted Support (SoS), ensure that your host is adequately secured. Successful enablement of this capability without proper authorization indicates either read access to the Controller’s serial console or the host filesystem.
Controller Chat Support
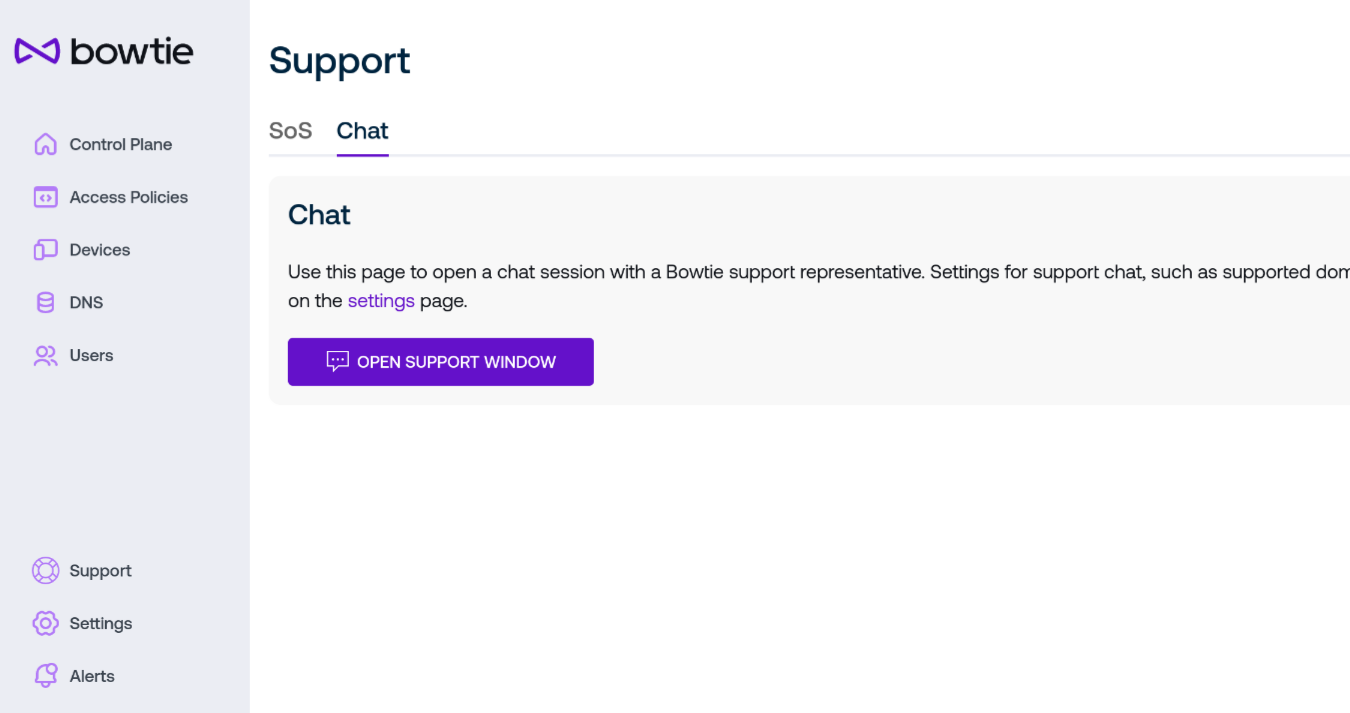
If Chat Support is enabled, the button on this page will open a new in-browser chat window to initiate a session with a Bowtie support agent. Note that the prerequisites listed on Chat Support must be met for this button to be operational.
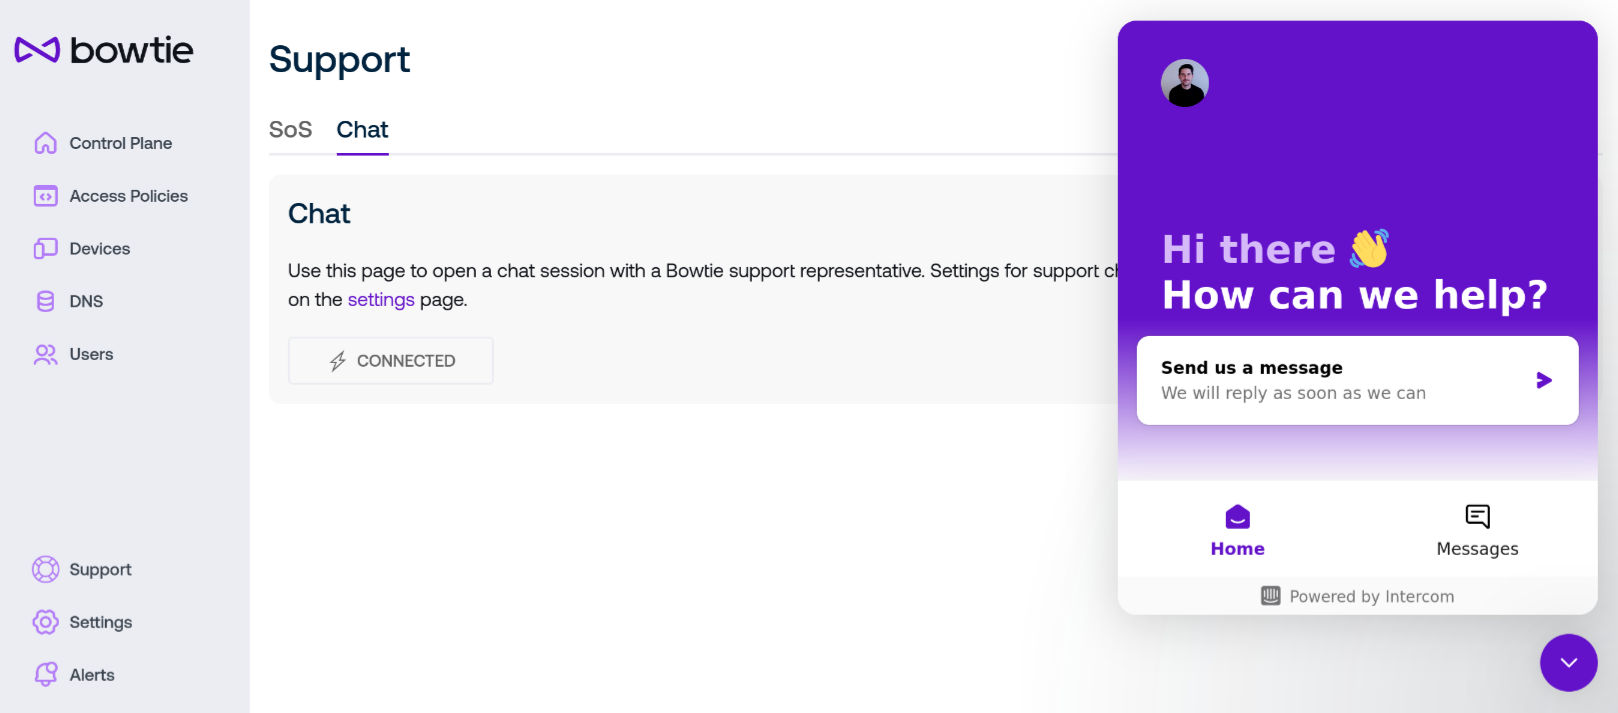
After clicking the button to initiate the chat, use the widget to send a message or view previous cases with Bowtie support.
Console Access
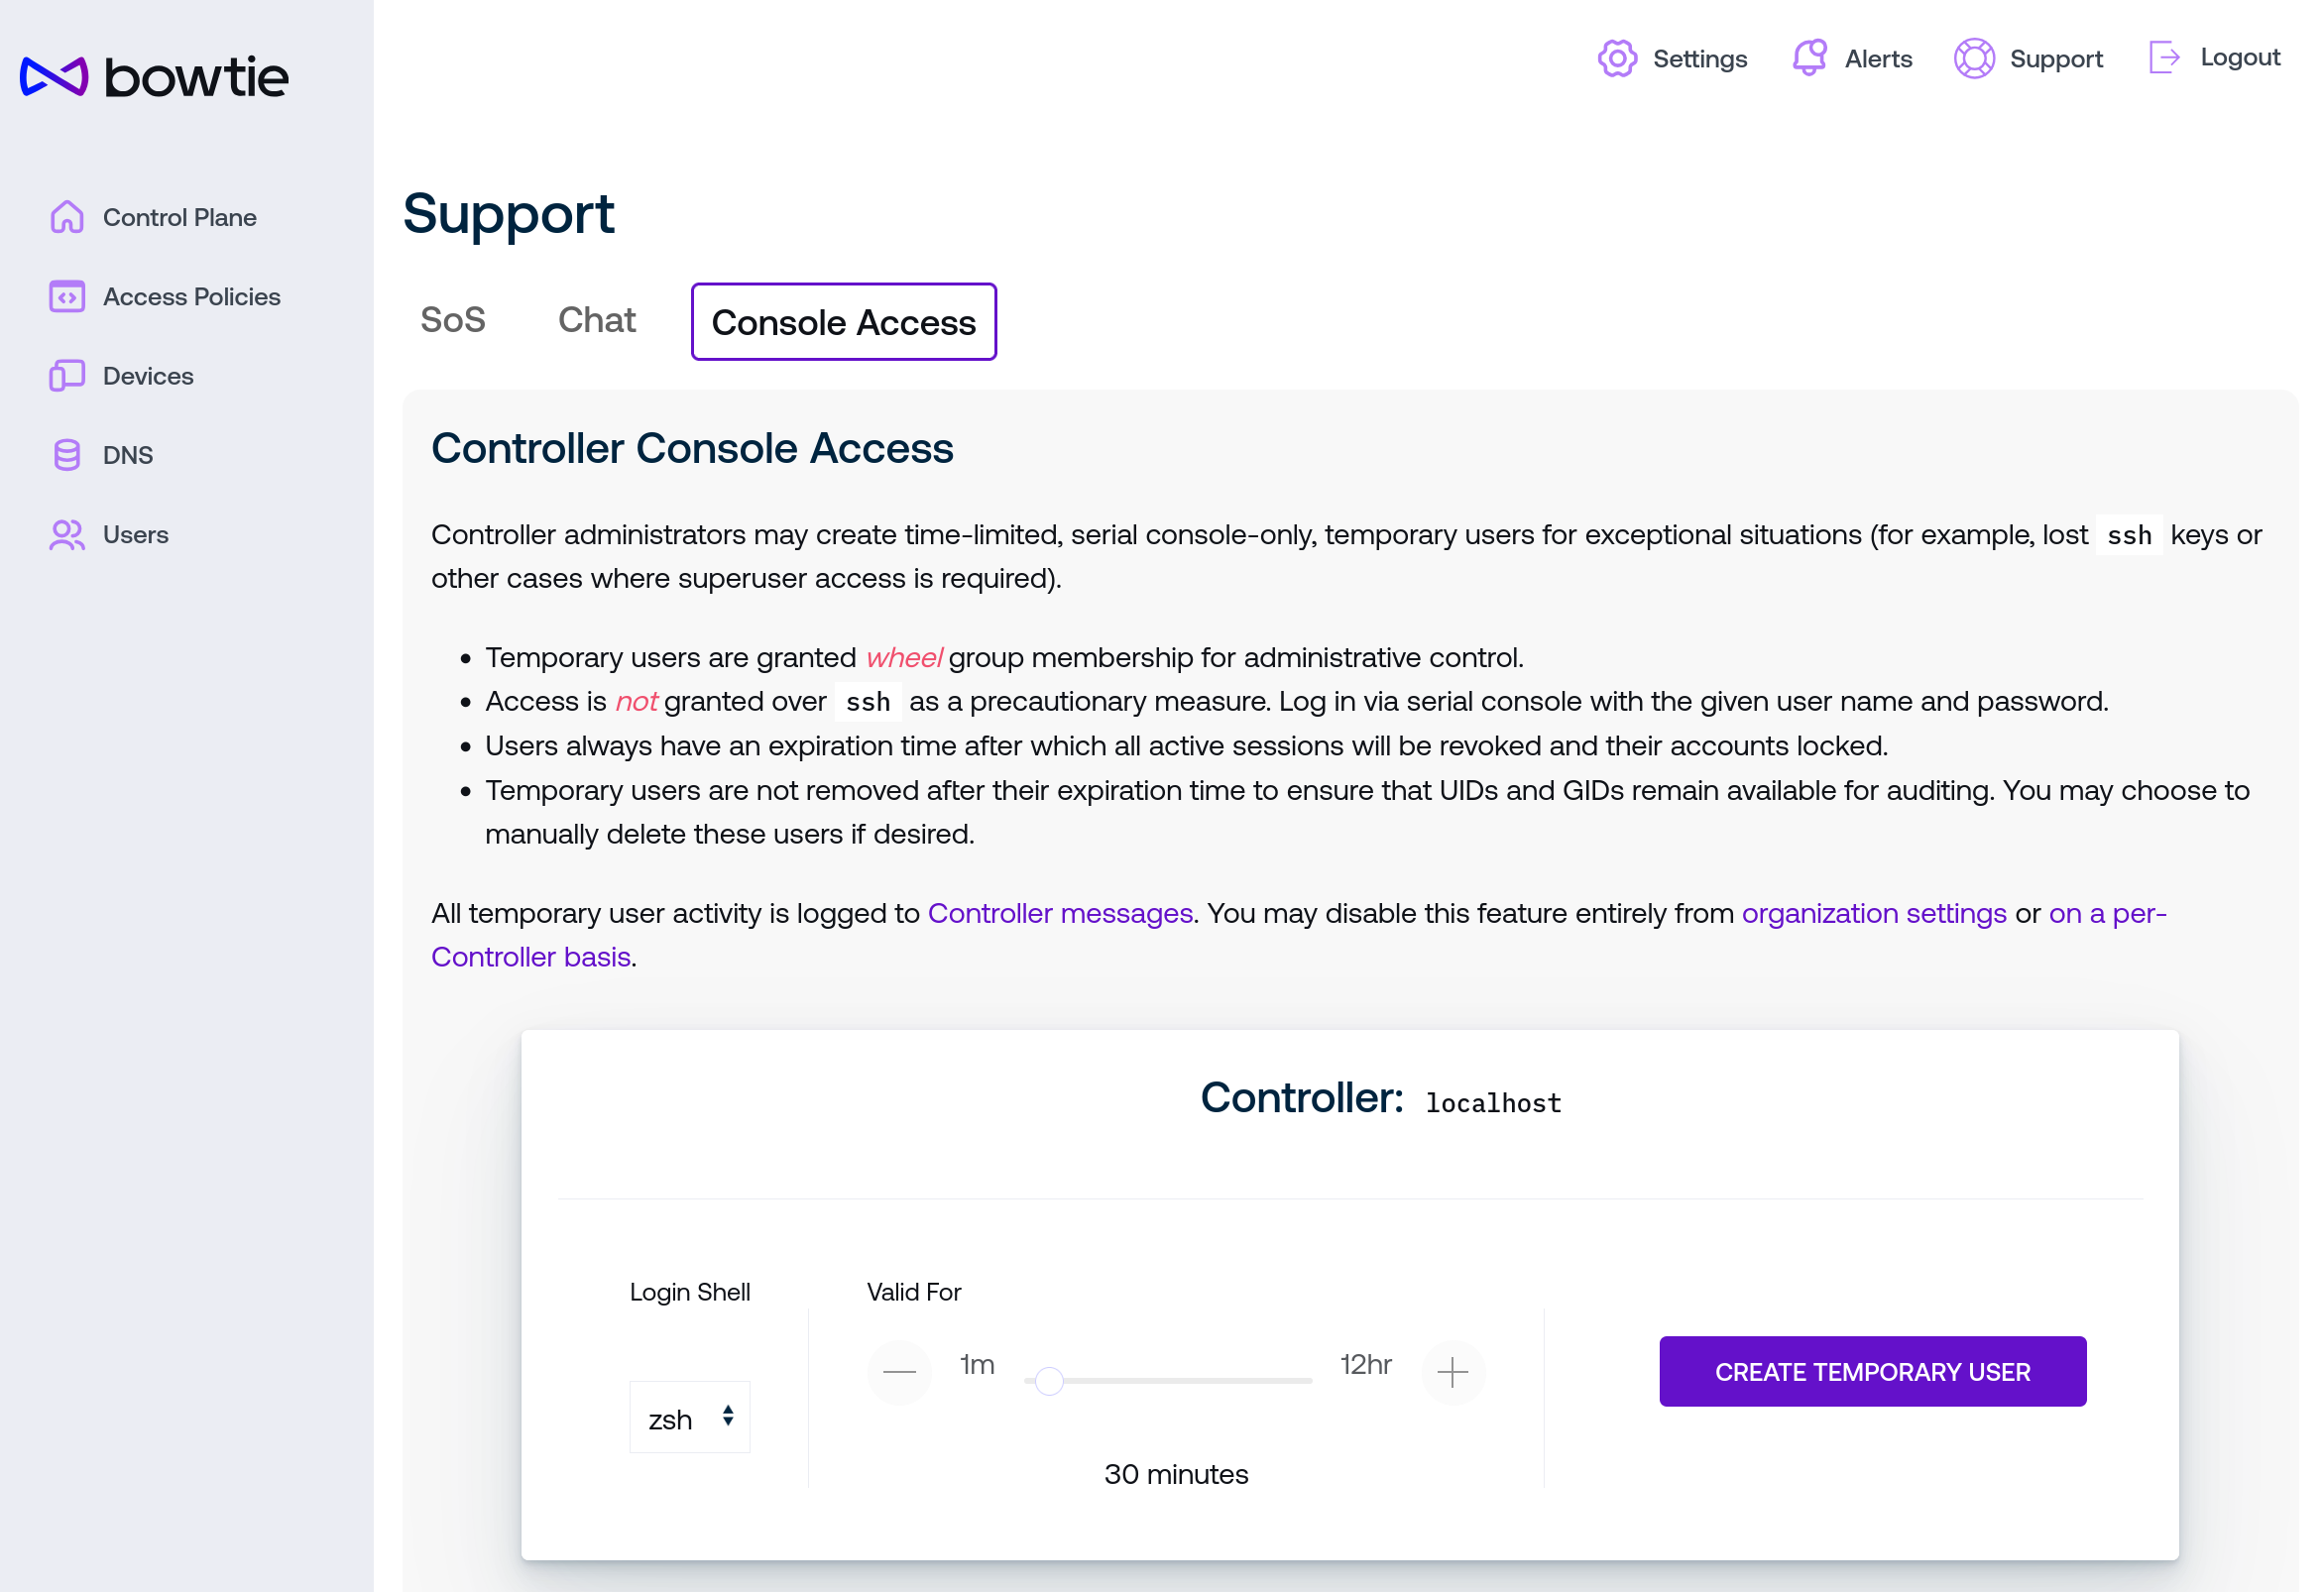
If organization-wide console user access and Controller-level console access is enabled, this page permits users with Owner privileges to create temporary users that may log in to Controller hosts via serial console.
These user accounts are fully-privileged members of the NOPASSWD wheel sudo group.
The following restrictions apply to these types of temporary users:
They are subject to a limited valid lifetime. After their configured expiration time lapses, all active sessions are terminated and the account is locked. Created users are subject to a maximum validity time (at time of writing, this limit is 12 hours).
Console User Time Limits
For more fine-grained controls of these limits, you may set the relevant environment variables for
bowtie-server.serviceon Controllers to customize the default expiration limit, minimum valid time, and maximum valid time. Consultbowtie-server --helpfor these environment variable values and Bowtie Server for additional information regarding how to set these variables.Logins may not occur over
ssh.Sessions are audited in Controller
bowtie-server.servicelogs, in Messages and Notifications, and may be forcibly terminated from the Control Plane web interface.
To create temporary console users, use the controls to choose a login shell and valid user lifetime duration. Enable “harden password” to optionally introduce additional entropy into the randomly-generated password (without this option enabled, the password is generated from a word list to simplify entering it into console environments that may not allow copy/paste). Note that creating users may take time, especially for the first user, while key material is generated.
After user creation, refer to your platform’s method of accessing the serial console to obtain access. For example, these instructions explain how to access the serial console on EC2.
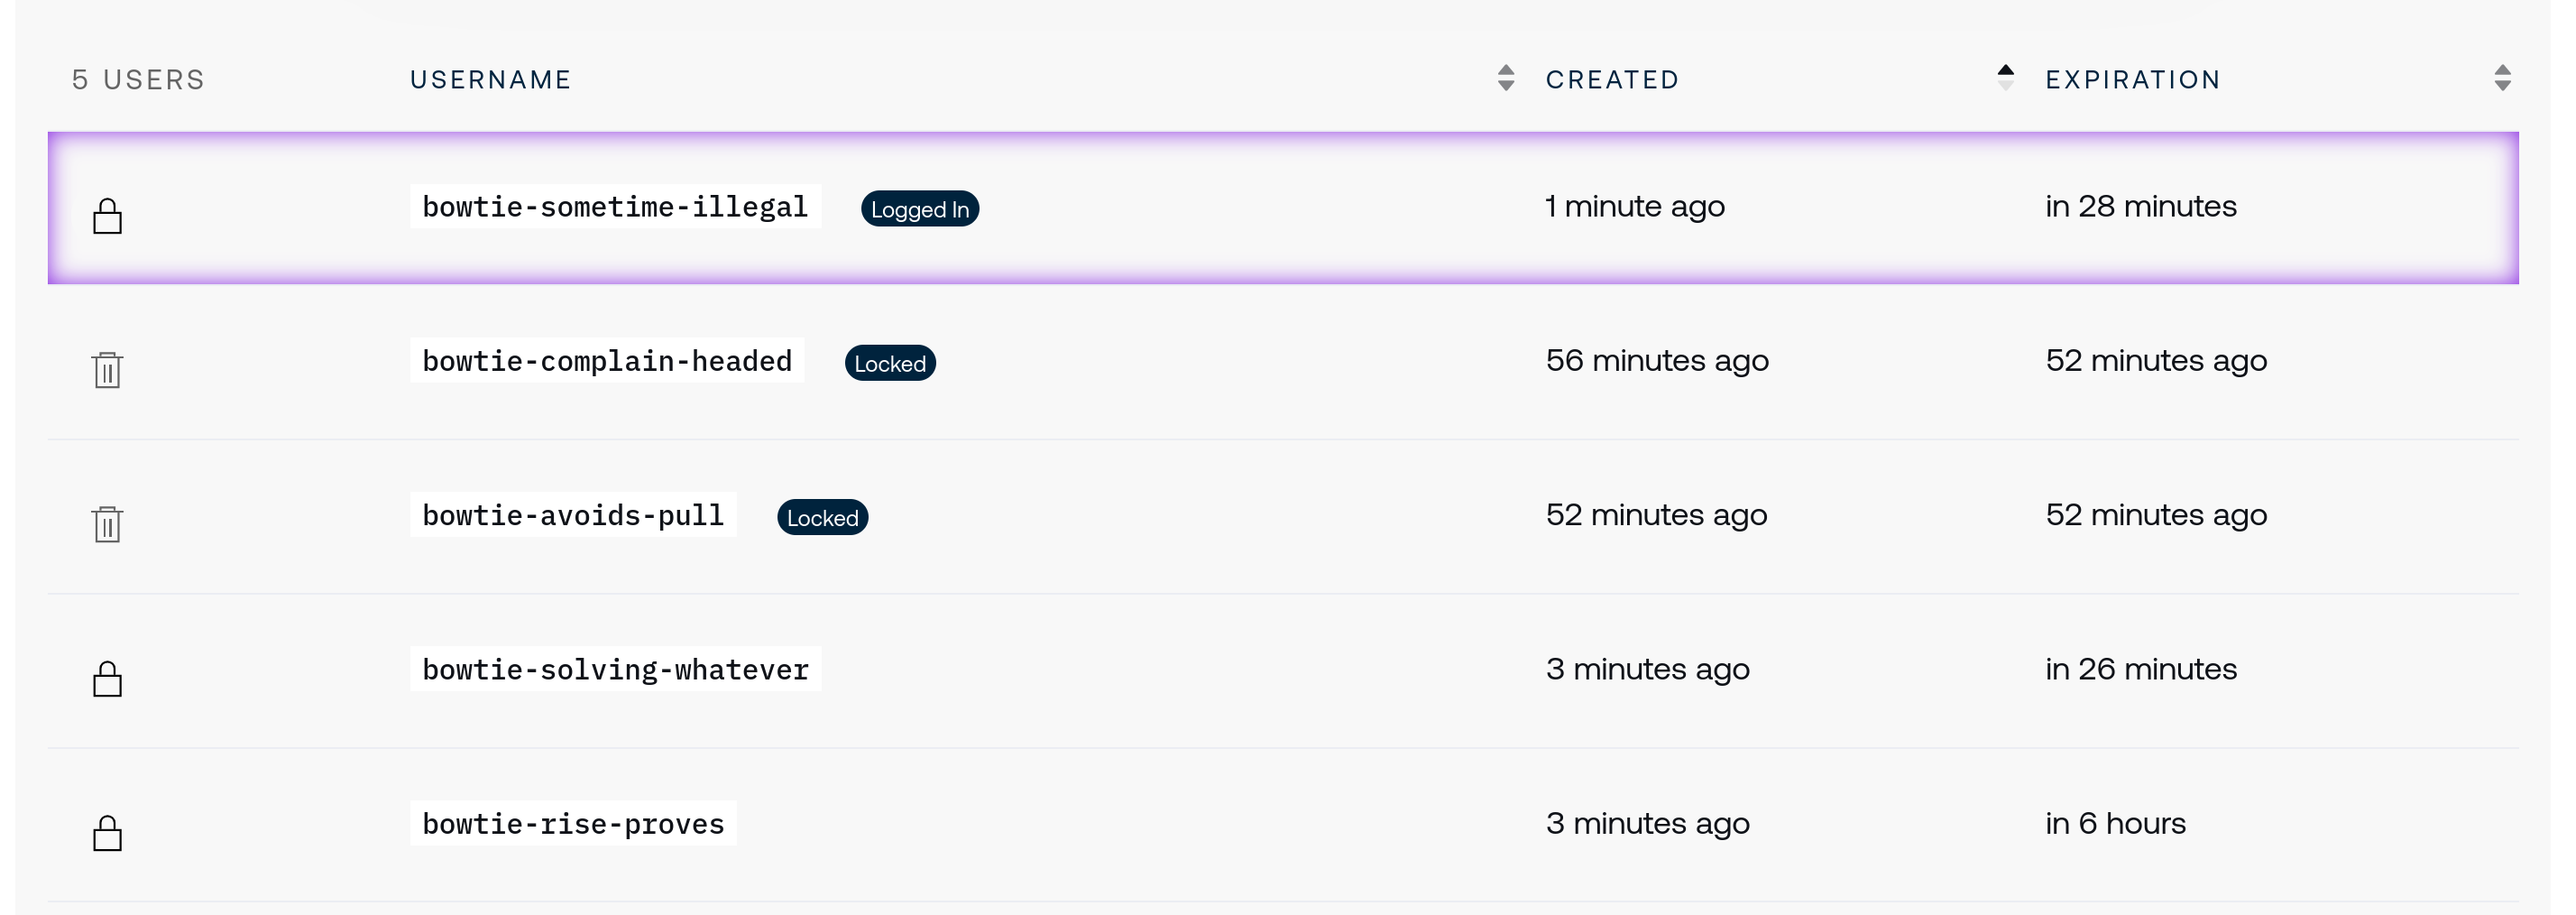
Use the user table list to:
Revoke users with active sessions, which are outlined with a purple highlight.
Forcibly expire user accounts before their predefined expiration time.
Delete temporary users.
Console User Accounts
Because temporary users have broad privileges, Bowtie recommends leaving these users in-place after their valid period expires. Logins may not occur for expired users, but their UID and GID values remain present in the event that an administrator may need to examine temporary user activity.
Controller REST API
In addition to the Controller web interface, all Controllers host a REST API accessible from the same HTTPS endpoint as the web-based control plane interface. Because all web-based operations interact with this API, every action that can be taken in a browser is also available via this API-based method. Many users may choose to consume this API in the form of the Bowtie Terraform Provider, but for ad-hoc operations that require less control than Terraform provides, configuring Controllers via API is a supported mode of operation.
The Controller API is self-documenting in the form of an OpenAPI specification. To retrieve this document, request one of the following endpoints from your Controller:
/-net/swagger-ui/Run an in-browser viewer of the OpenAPI specification document. This page also provides a link to download the specification JSON document or issue sample requests.
/-net/api/v0/openapi.jsonRetrieve the OpenAPI specification manually for use in local utilities or libraries.
For example, if your Controller runs at https://bt0.example.com, the OpenAPI Swagger endpoint would be located at https://bt0.example.com/-net/api/v0/openapi.json.
API Authentication
API Keys are used to authenticate requests against the Controller Controller REST API. See the documentation about API Keys for additional information.
The API expects JSON payloads when request bodies are sent and responds with JSON-encoded responses when warranted.
API Versioning and Stability
The Controller REST API carries its version in the URL path. The current version is v0 (for example, /-net/api/v0/policy). Version v0 is an evolving interface: endpoints and request or response payloads may change between Controller releases as the platform develops. Code written directly against v0 should be reviewed when you upgrade Controllers.
For automation that must remain stable across upgrades, use the Bowtie Terraform Provider or the Bowtie Pulumi Provider rather than calling v0 directly. Each provider is released and versioned independently of the Controller, follows semantic versioning, and is pinned to a version that you choose. The providers absorb changes to the underlying API on your behalf, so that your infrastructure-as-code continues to work as the API evolves. Bowtie recommends the providers as the interface for production automation, with the raw v0 API best suited to ad-hoc scripting and exploration.
Controller Maintenance
Maintenance protocols depend on whether you are operating your Bowtie Controller as a virtual machine or container-based deployment.
Cloud Deployments and Virtual Machines
Because Controllers are Linux systems, they will typically require a degree of regular maintenance in the form of updates or monitoring. This section outlines the capabilities and features that are designed to make this process easier.
Updating Controllers
Updating deployed Controller appliances is an important operational task to ensure that you receive important updates to Bowtie software and the Controller operating system configuration.
A core tenet of the philosophy for Bowtie’s notion of secure network access is that Bowtie (the company) will not and can not access your private information.
The automatic and manual Controller update process sends a minimal amount of information to negotiate updates with our infrastructure that includes information required to update successfully, such as the current version of the requesting Controller, but does not include information such as key material or configuration data.
Updates do not grant access to Controllers or private networks via methods like ssh or for support tools – updates are comprised of generic system profiles that do not bundle any privileged access mechanisms by Bowtie employees or others.
The following modes of operation are supported:
Choosing the Controller update strategy via Controller settings or organization-wide defaults.
Updating via an interactive, terminal-based interface.
Moving to desired versions or the latest version directly via command-line flags.
Enabling automatic, unattended updates.
For each update strategy, any updated services or daemons will restart automatically – no further steps are required.
Update Space
Bowtie Controllers ship with periodic jobs to clean up unused system space so system updates can be performed regularly.
Update Options
Consult update --help for a complete list of supported actions when updating with one of the terminal-based update methods.
Managed Updates
Use the Control Plane web interface to configure organization-wide version strategies or individually-configured per-Controller upgrade strategies. Each of the options detailed below in Command Line Updates has related settings available for customization in the Control Plane web interface.
Bowtie suggests relying on the Control Plane web interface in order to orchestrate updates across clusters of Controllers in a managed view. While managed updates are functionally equivalent to Command Line Updates, managed updates require less manual intervention.
Command Line Updates
Instead of configuring updates with Managed Updates, you may instead elect to perform updates manually or configure them from the command line.
Release Channels
Operators may opt-in to pre-release build candidates if you require the very latest updates for bleeding-edge features or bugfixes.
To do so, either use the --prerelease flag when using the update command-line utility, or set the BOWTIE_PRERELEASE environment variable for update processes triggered by Unattended Updates.
For example, the following command will configure any update activity triggered by automatic updates to fetch versions from the pre-release channel:
echo BOWTIE_PRERELEASE=1 > /etc/default/update
Interactive Updates
We suggest using Controller update settings, Unattended Updates, or the –latest flag when updating your network appliance, but you may optionally choose an interactive interface if you require a specific version.
To enter the system update interface, invoke the update command-line utility from a terminal shell. This process requires elevated permissions either in the form of sudo or execution by the root user:
update
Terminal Access
To access the command line on a Bowtie Controller, use cloud-init at first boot to load trusted ssh keys onto the host’s root user.
The update interface will present you with a list of available system profiles to select from:
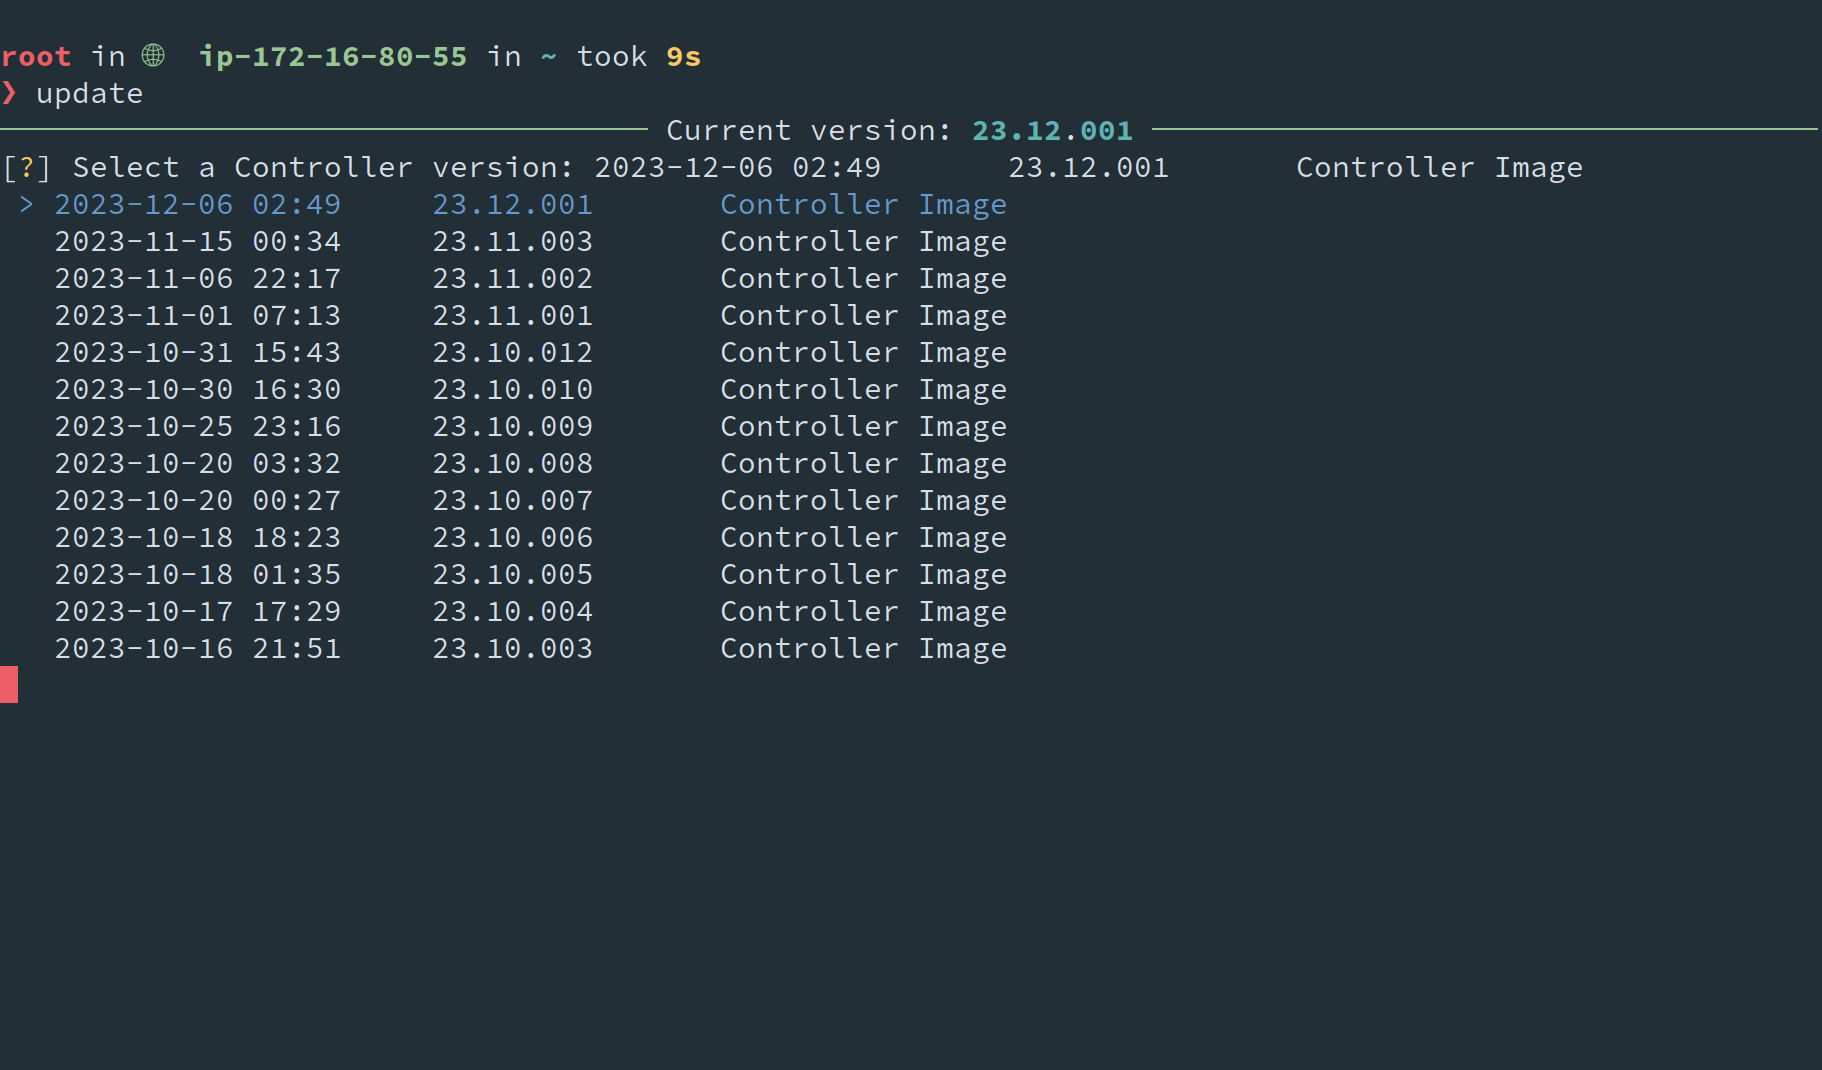
You may navigate between options with the arrow keys. Options are presented in reverse chronological order with the latest versions at the top of the list, which is highlight by default.
Once you have chosen your desired Controller image, select it with Enter. The utility will retrieve the new Controller image and update your system:
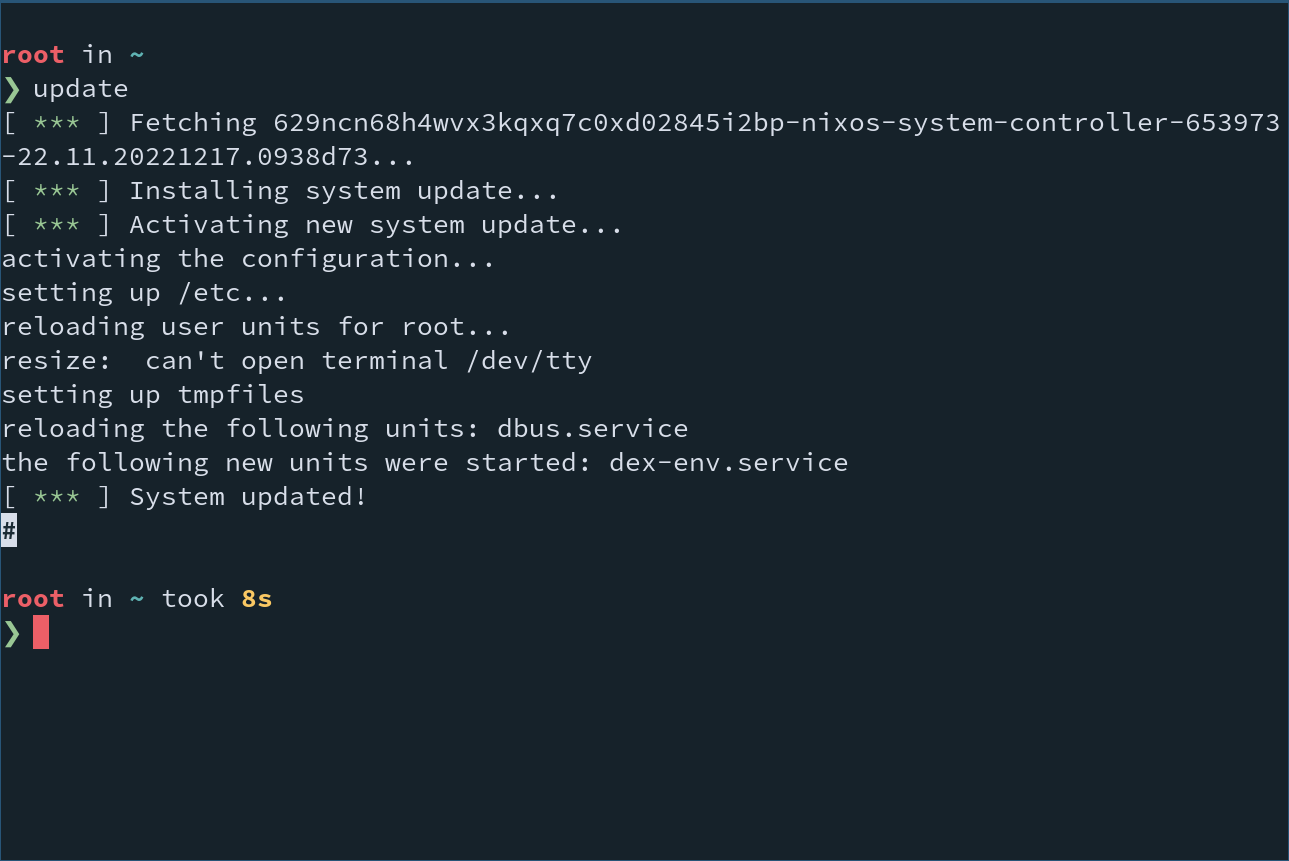
Non-interactive Updates
You may choose to move directly to a Controller version without entering the interactive selection interface:
Latest Updates
Pass the --latest flag to update in order to update to the latest release.
This flag is suitable for workflows like automation tools that may log in remotely via ssh to periodically update Controllers.
update --latest
Specific Version Updates
Alternatively, you may elect to move to a specific version with the --version flag.
To retrieve a list of released versions, use the info sub-command:
update info
The --json flag may be passed for output suitable for consumption via programs or scripts:
update info --json
Once you have chosen a desired version, pass it to the update command to move directly to the indicated release:
# Replace 23.07.001 with your desired version
update --version 23.07.001
Unattended Updates
If you would like to opt into completely unattended updates that take place without any user interaction, update supports this mode of operation as well.
Controller Update Settings
Unattended updates may also be configured via the web interface on the Controller settings page.
Updates are scheduled via a systemd timer. Unattended updates always move to the latest published version. Published versions may be found via the update command, the Bowtie downloads page, or the remote Bowtie packages API (Swagger, Redoc, OpenAPI).
Automatic updates are enabled when the file /etc/update-at file is present and disabled if the file is removed.
Enabling and disabling unattended updates occurs automatically when the file is either created or removed; no other actions are necessary.
By default, automatic updates are set to occur with the systemd timer option OnCalendar=daily, which executes updates at 00:00:00 UTC.
Any contents of /etc/update-at are loaded as systemd “drop-in” units that may override specific settings to fully control the timer’s schedule and execution logic to honor different schedules.
Automatic Update Examples
Enable automatic, unattended daily updates that will fire once per day:
touch /etc/update-at
Disable automatic updates:
rm /etc/update-at
The remaining examples assume that the indicated file content is placed into /etc/update-at.
Run automatic updates at 4:00 AM UTC every day.
Note that adding OnCalendar= clears the previous daily setting to run only at 4:00.
[Timer]
OnCalendar=
OnCalendar=4:00
Run automatic updates at 1:00 PM UTC every day at some randomized delay within a one-hour window:
[Timer]
OnCalendar=
OnCalendar=13:00
RandomizedDelaySec=1hour
Same as the previous example, but choose the same random delay between executions unique between hosts. Useful to maintain a consistent schedule that remains different between individual hosts.
[Timer]
OnCalendar=
OnCalendar=13:00
RandomizedDelaySec=1hour
FixedRandomDelay=yes
Run automatic updates at 1:00 AM UTC every Sunday:
[Timer]
OnCalendar=
OnCalendar=Sun *-*-* 01:00:00
Run automatic updates every six hours.
The OnActiveSec= option instructs systemd to wait for the indicated time duration since the timer began:
[Timer]
OnCalendar=
OnActiveSec=6hours
Consult the manual pages for systemd.timer to find all available options that can be set in the /etc/update-at file and the manual page for systemd.time for all supported time definition formats.
System Configuration
Each Controller provides additional mechanisms to control various aspects of the systems’ configuration such as data retention periods.
System Administration
Some of the following steps assume console-level access to your Controller in order to perform actions like read or write configuration files. Pre-loading a trusted ssh key with cloud-init is the recommended approach.
Bowtie Server
Under most cases you should not need to change the running configuration of the bowtie-server.service daemon that serves as the central point for most Controller operations.
Aside from configuring initial settings like SITE_ID and BOWTIE_SYNC_PSK, other settings are configured automatically.
If you do encounter a situation in which its settings should be changed, use the following guidelines.
Note that you can discover configurable settings via bowtie-server --help at the command line:
Use files underneath the path
/etc/bowtie-server.d/to set environment variables in the format outlined inman 5 systemd.exec. For example, the following command enables verbose logging:echo RUST_LOG=debug > /etc/bowtie-server.d/logging.conf
To restore the previous logging level:
rm /etc/bowtie-server.d/logging.confNote that
bowtie-server.servicewatches for changes to these files, so manually restarting withsystemctl restart bowtie-serveris not necessary.The file at
/etc/default/bowtie-serveris also a source for environment variables but usually reserved for internal use. You can freely introspect this file while debugging Controller operations but we suggest confining user-edited changes to files in/etc/bowtie-server.d/.
Controller Networking
Bowtie Controllers use systemd-networkd to configure networking. By default, all network interfaces fetch addresses via DHCP.
Changes to network configuration should follow the syntax outlined for systemd-networkd .network files.
Networking Boot Configuration
To bootstrap your network configuration at launch time, reference the documentation for how to achieve this using cloud-init.
As an example, consider the case of a second network interface attached to a running Bowtie Controller that is linked to a private network space with addresses that are strictly allocated and not available via DHCP. To configure a network interface on this pre-existing Controller:
Log into the Controller using
ssh. If you launched the Controller via an AWS AMI, you chose a public key at launch time that will permit you to log in as therootuser. In on-premise environments, you should define a trustedsshkey at the time of instance creation using cloud-init.View attached network interfaces to find your desired interface to configure with a static address. You can use the standard
ip linkcommand:$ ip link ... 2: ens5: <BROADCAST,MULTICAST,UP,LOWER_UP> mtu 9001 qdisc mq state UP mode DEFAULT group default qlen 1000 link/ether 0a:43:55:af:1c:18 brd ff:ff:ff:ff:ff:ff ...Alternatively,
systemd-networkdcan also yield additional information:$ networkctl ... 2 ens5 ether degraded configuring ...
In this example, we’ll assign a static address to
ens5.Place a
.networkconfiguration file into the directory/etc/systemd/networkwith options from the systemd-networkd documentation. For example, to assign the interfaceens5a static address of192.168.1.200with the gateway192.168.1.1, create the file/etc/systemd/network/10-ens5.network:[Match] Name=ens5 [Network] Address=192.168.1.200/24 Gateway=192.168.1.1
Network Configuration Precedence
Bowtie Controllers rely on default networking configuration files that defer to DHCP by default. In order to adhere to lexical load ordering, ensuring that your
.networkfile begins with a higher precedence than99such as10-ens5.networkor00-eth2.network.Prompt
systemdto reload and then reconfigure the network:$ systemctl daemon-reload $ networkctl reload
Confirm that the network interface has been assigned the correct configuration with
ip address.
Future Improvements
These low-level steps will be superseded by Controller web interface capabilities in future updates.
Observability
Bowtie controllers aggregate metrics for self-monitoring via Prometheus, logs via OpenTelemetry collector stored in Loki, and traces via the OpenTelemetry OTLP protocol stored in Tempo.
Two potential approaches are available to consume these forms of telemetry:
Use the self-hosted Grafana instance to view observability data on the Controller itself. This works with little or no configuration, but data is ultimately stored host-local and not persisted anywhere else.
Optionally forward these telemetry streams off the host to your own preferred platform of choice. This requires additional configuration but offers the ability to bring telemetry data into your existing monitoring environment.
Policy Auditing
Refer to Policy Verdict Tracking for a more comprehensive deep dive on observability regarding firewall/policy packet tracking.
Exporting Telemetry
The OpenTelemetry Collector runs on each Controller and is responsible for the aggregation and management of on-host telemetry data. The existing default pipelines serve to enable the self-hosted observability stack but are also available for further customization which you may take advantage of to ship data to additional endpoints. User-defined configuration amendments should be placed at /etc/otel.yaml.
To begin, reference the existing opentelemetry-collector configuration file in order to find any relevant receivers that you would like to tap into. You can find the configuration file path by referencing the running systemd unit file with a command such as systemctl cat opentelemetry-collector or use a shell pipeline like the one below to display it directly:
busctl get-property org.freedesktop.systemd1 \
       /org/freedesktop/systemd1/unit/opentelemetry_2dcollector_2eservice \
       org.freedesktop.systemd1.Service ExecStart -j \
    | jaq -r '[.data[0][1][] | select(contains("config"))] | first' \
    | cut -d: -f 2 | xargs cat
As an illustration, at time of writing, the collector configuration was the following:
# Required to persist the journald cursor.
extensions:
  file_storage/journald:
    create_directory: true
    directory: ${env:STATE_DIRECTORY}/journald
# Inputs:
receivers:
  # Parse system logs.
  journald:
    convert_message_bytes: true
    directory: /var/log/journal
    operators:
    - field: resource.job
      type: add
      value: systemd-journal
    - from: body._SYSTEMD_UNIT
      if: body._SYSTEMD_UNIT != nil
      to: resource.unit
      type: copy
    - from: body.SYSLOG_FACILITY
      if: body.SYSLOG_FACILITY != nil
      to: resource.syslog_facility
      type: copy
    - from: body.SYSLOG_IDENTIFIER
      if: body.SYSLOG_IDENTIFIER != nil
      to: resource.syslog_identifier
      type: copy
    - from: body.MESSAGE
      to: body
      type: move
    - field: body
      regex_name: ansi_control_sequences
      type: regex_replace
    - if: resource.unit == "caddy.service" || resource.unit == "dex.service"
      on_error: send_quiet
      parse_to: body
      type: json_parser
    - field: resource.http
      if: resource.unit == "caddy.service" && body?.msg == "handled request"
      type: add
      value: access
    - from: body.status
      if: resource.unit == "caddy.service" && body?.msg == "handled request"
      to: attributes.status
      type: move
    storage: file_storage/journald
  # Accept inbound traces.
  otlp:
    protocols:
      grpc:
        endpoint: 127.0.0.1:4317
      http:
        endpoint: 127.0.0.1:4318
  # Scrape the local instance for potential use in custom exporters.
  prometheus/federated:
    config:
      scrape_configs:
      - job_name: federate
        metrics_path: /federate
        params:
          match[]:
          - '{job="local-exporter"}'
          - '{job="dex"}'
          - '{job="caddy"}'
          - '{job="controller"}'
          - '{job="loki"}'
          - '{job="otel-collector"}'
          - '{job="wireguard"}'
          - '{job="nfqueue"}'
        static_configs:
        - targets:
          - 127.0.0.1:9091
# Post-process journald fields.
processors:
  attributes/journald:
    actions:
    - action: insert
      key: loki.format
      value: logfmt
    - action: insert
      key: loki.resource.labels
      value:
      - http
      - job
      - syslog_facility
      - syslog_identifier
      - unit
    - action: insert
      key: loki.attribute.labels
      value:
      - status
      - level
# Define local logs and span stores.
exporters:
  loki:
    endpoint: http://localhost:3100/loki/api/v1/push
  otlp/tempo:
    endpoint: 127.0.0.1:3217
    tls:
      insecure: true
# Connect each stream.
service:
  extensions:
  - file_storage/journald
  pipelines:
    # Local logs flow from journald into loki
    logs:
      receivers:
      - journald
      processors:
      - attributes/journald
      exporters:
      - loki
    # Traces arrive from the OTLP port and land in Tempo.
    traces:
      exporters:
      - otlp/tempo
      receivers:
      - otlp
  telemetry:
    metrics:
      address: 127.0.0.1:8888
OpenTelemetry Collector Contrib
We refer to the OpenTelemetry agent as opentelemetry-collector in this documentation, but the service runs opentelemetry-collector-contrib so that as many receivers, processors, and exporters are available as possible. When selecting plugins that support your infrastructure, you may choose from any that opentelemetry-collector-contrib supports.
At a high level, to capture these telemetry streams,
Define a new
exporterthat instructsopentelemetry-collectoron how to connect to your endpointAppend your exporter to the desired logs, metrics, or traces pipeline.
For example, you may have a Loki instance deployed in a centralized fashion that aggregates logs across your entire infrastructure. Ingesting logs from your Bowtie Controller could be done by populating /etc/otel.yaml with the following:
exporters:
  loki/universal-paperclips:
    endpoint: https://logs.universal-paperclips.co:3100/loki/api/v1/push
service:
  pipelines:
    logs:
      exporters:
      - loki/universal-paperclips
Note that:
The exporter name should be unique to ensure no conflicts with the stock configuration (in this example,
loki/universal-paperclips)You may include any valid configuration for the exporter you define – the YAML in this file is simply passed along to
opentelemetry-collector. In this case, the settings listed under the Loki exporter plugin are all valid.Any environment variables present in
/etc/default/opentelemetry-collectorwill be passed into the service and referenced with the syntax${env:MY_ENV_VAR}per the opentelemetry-collector configuration documentation.. This is a good place to store potentially sensitive values to avoid literal inclusion within the configuration file.
After making changes to /etc/otel.yaml, trigger a service restart with systemctl restart opentelemetry-collector and optionally follow any logs with a command like journalctl --unit opentelemetry-collector --follow.
YAML content in /etc/otel.yaml will be deeply merged with the default running configuration and the new Loki exporter will emit logs both to the local instance and the loki/universal-paperclips exporter. Any of the other metrics or tracing pipelines can be similarly extended to extract and collect their respective telemetry streams into private endpoints.
Configuring Outgoing Telemetry
Other valid opentelemetry-collector configuration keys can be set, but exercise caution when combining the default Bowtie configuration with your own. For example, you have the full capability to define your own processors, but should take care to avoid collisions like naming a second Prometheus endpoint prometheus. Consult the running Bowtie configuration file to ensure that your own configuration is complementary and avoids causing any errors.
Logs
Logs are retained for 30 days by default. Beyond the set retention limit, logs stored in Loki will be rotated, deleted, and unavailable for search in Grafana. If you instead elect to forward logs as outlined in Exporting Telemetry, these retention limits will only apply to the logs stored locally and not those sent to remote endpoints.
To configure this value, set the variable LOKI_RETENTION_PERIOD in the environment variable configuration file for the loki.service unit. For example, to increase the retention period to 60 days:
echo LOKI_RETENTION_PERIOD=60d >> /etc/default/loki
Any changes to this file will prompt Loki to reload its configuration, so no other actions are necessary. You may validate that the service is still running and healthy with systemctl status loki.service.
To update this value later to a shorter period by changing the file in-place:
sed -i 's/60d/7d/' /etc/default/loki
Future Improvements
These low-level steps will be superseded by Controller web interface capabilities in future updates.
Application Logs
When viewing logs through either journalctl, the built-in Grafana interface, or aggregating logs to integrate them into your own observability stack, use the following information to aid with constructing dashboards or other interfaces.
The following table assumes filtering on the systemd service name.
systemd unit |
Service |
|
Bowtie service daemon. Most Controller events are emitted by this application daemon. In particular, events logged with |
|
All backup activity is managed by this service and emits logs for backup activity (performing new backups, pruning snapshots, etc.) |
|
If Unattended Updates are enabled, this service performs updates according to the configured schedule. Logs are emitted when update checks are performed and when updates either succeed or fail. |
|
When leveraging full routing modes with BGP, these units manage routing activity. |
|
Monitor logs from this service for activity related to user SSO events. |
|
The bulk of |
|
In the event of Automated Restore, events regarding restored files and success or fail are logged by this service. |
Telemetry Event Schema
The Controller emits security-relevant activity as structured events, which makes them straightforward to index, alert on, and build dashboards from once forwarded to a SIEM or other platform via Exporting Telemetry. This section documents the fields that operators most often integrate against.
Every record exported over OTLP carries the following resource attributes, which identify the Controller that produced the event:
Attribute |
Description |
|---|---|
|
Always |
|
The stable identifier of the Controller that emitted the event. |
|
The hostname of the Controller that emitted the event. |
Audit events additionally carry audit_event=true along with an audit_type field that names the category of event.
Filter on audit_event=true to isolate audit events, then on audit_type to select a category:
|
Description |
|---|---|
|
User authentication and authorization activity (sign-in attempts, successes, failures, lockouts, and role changes). |
|
Per-packet policy verdicts from the network control plane (see Policy Verdict Tracking). |
|
Device activity (enrollment, state changes, address assignment, and removal). |
|
Temporary privileged console access on a Controller. |
|
Mobile device management synchronization and configuration changes (for example, |
Authentication events.
Events with audit_type=user are the primary signal for authentication monitoring.
The login field records the outcome of each attempt:
Field |
Description |
|---|---|
|
Outcome of the attempt: |
|
Authentication method: |
|
The username associated with the attempt. |
|
The unique identifier of the user, when known. |
|
The email address associated with the user. |
|
The source address the request originated from. |
|
Present on denials to indicate the cause, such as |
Policy verdict events.
Events with audit_type=packet_queue describe the decision made for an individual packet.
Enable them with the Track Policy Verdict Logs setting (see Controller settings); they are disabled by default because of their volume.
Field |
Description |
|---|---|
|
Transport protocol, such as |
|
Source IP address of the packet. |
|
Source port, or |
|
Destination IP address of the packet. |
|
Destination port, or |
|
When the destination is a NAT64 address, the embedded IPv4 address; otherwise |
|
Identifier of the source device, or |
|
Display name of the source device, or |
|
Identifier of the user the device is assigned to, or |
|
The action taken: |
|
Why the verdict was chosen, such as |
Field Values
Absent fields are emitted as the literal string null rather than omitted, and the verdict and reason values use the capitalization shown above.
Searches and alerts should match these values exactly.
The same information is available as a metric when Track Policy Verdict Metrics is enabled: a counter named bowtie_policy_verdict whose labels mirror the fields above (protocol, source_address, destination_address, verdict, reason, and so on).
Metrics incur less overhead than logs at high traffic volumes; see Policy Verdict Tracking for guidance on choosing between them.
Forwarding events to a SIEM.
Because the Controller emits these events over OTLP into the local opentelemetry-collector (see Exporting Telemetry), you can forward them to any destination the collector supports.
For example, to stream audit logs to Splunk over the HTTP Event Collector (HEC), place the following at /etc/otel.yaml:
exporters:
  splunk_hec/audit:
    token: ${env:SPLUNK_HEC_TOKEN}
    endpoint: https://splunk.example.com:8088/services/collector
    source: bowtie-controller
    sourcetype: bowtie:audit
service:
  pipelines:
    logs:
      exporters:
      - splunk_hec/audit
Store the token in /etc/default/opentelemetry-collector as described in Exporting Telemetry, then restart the collector.
Each event arrives with the resource attributes and fields documented above, so your SIEM can index and search on audit_type, login, verdict, user_id, and the rest without additional parsing.
A generic destination works the same way using the otlphttp exporter in place of splunk_hec.
Metrics
Use Grafana to explore relevant metrics that are aggregated from many sources including:
The local host’s resources (CPU, memory, and more)
The Bowtie server daemon
Reverse proxy/web server instrumentation
The Explore page on the Grafana sidebar includes a Prometheus drop-down at the top of the page to discover available metrics. Use this interface or the pre-built dashboards to drill down into available metrics.
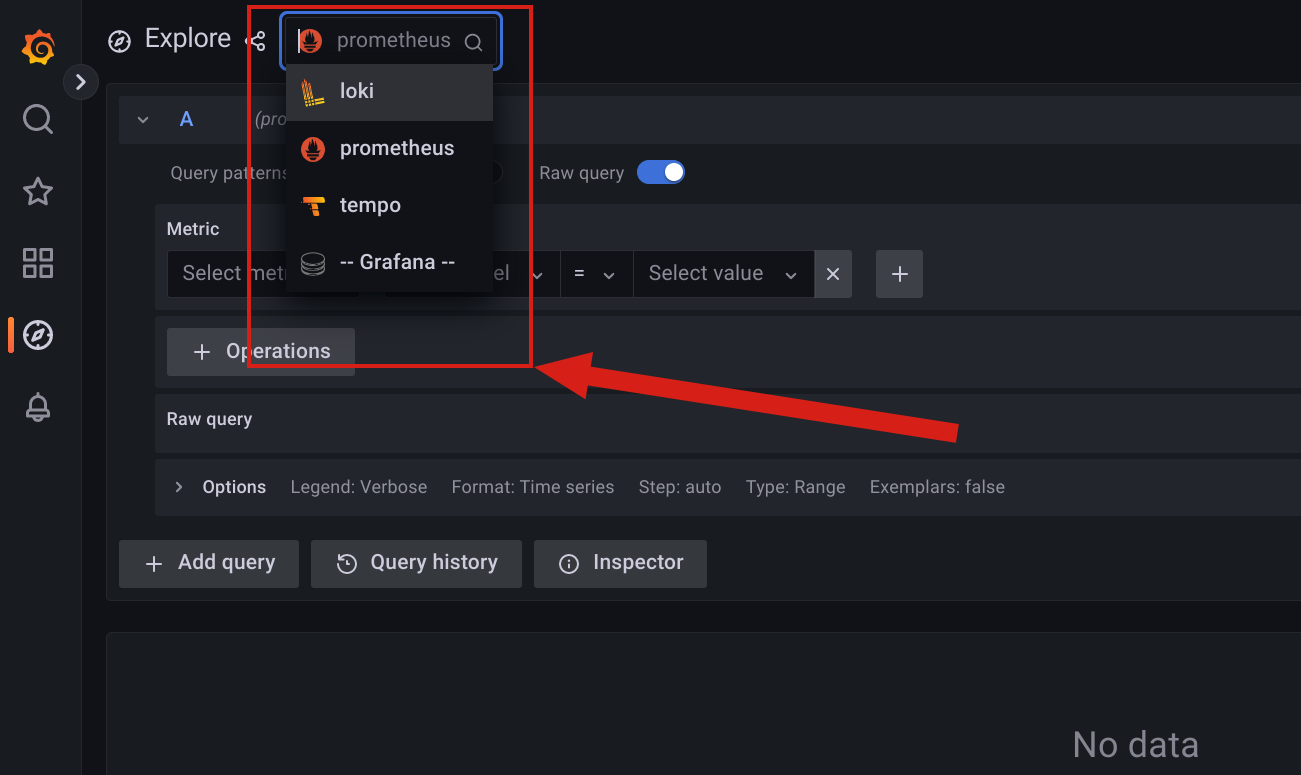
Metrics Federation
When Exporting Telemetry, you may choose to scrape the Controller’s Prometheus endpoint to aggregate metrics in your own infrastructure from a single place. If you take this approach, remember to use federation to avoid only scraping Prometheus itself. If you need a list of labels to match when requesting federated metrics, use this example to find the list of metrics that you can then draw from in your federated setup.
In some cases, administrators may need to collect metrics from additional scraping endpoints.
The default prometheus.service daemon on Controllers specifies the following configuration by default, which permits for persistent custom scraping configurations:
scrape_config_files:
  - /etc/scrape_config_files.d/*.yml
Traces
Drill down into traces that instrument spans within the Bowtie application by either:
Clicking on the link that appears alongside
traceIDin associated log lines when viewing Loki logs, orUsing the
Exploreinterface and selectingtempofrom the drop-down at the top of the page.
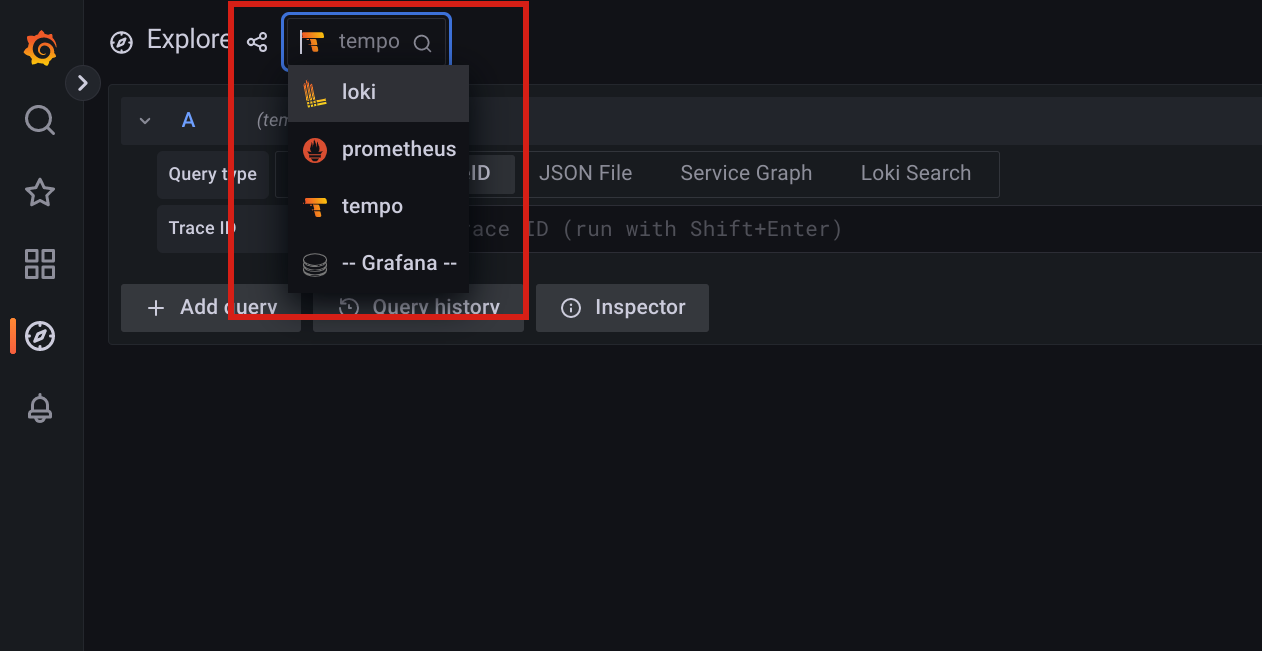
Zabbix
Controllers include the Zabbix agent 2 daemon for use in environments that require it.
To use the agent, define a configuration file at the path /etc/zabbix_agent2.conf using any desired configuration parameters.
The zabbix-agent systemd service will automatically run when this file is created or modified.
Recall that Bowtie Controllers are optimized appliance images and may not include your desired modules out-of-the-box. If you require extended Zabbix agent capabilities that are not present on the latest Controller images, reach out to a Bowtie representative who can help.
Web Configuration
The web server that hosts the Control Plane Interface provides configurable settings for additional customization at the reverse proxy layer.
Strict Transport Security
Enabling HTTP Strict Transport Security may be desirable if you intend to enforce TLS across the entire domain hosted by your Bowtie Controller. Before enabling HSTS, be aware of the impact that enabling this header may have upon the endpoint (such as taking steps to ensure that TLS is functional) and the longevity of the setting based upon the max-days parameter.
To configure this header, set the HSTS environment variable in the /etc/default/caddy file. For example, to set the Strict-Transport-Security header to "max-age=31536000; includeSubDomains", issue the following command from the command line on a running Bowtie Controller (this example uses sudo, you may omit it if executing as root):
echo 'HSTS=max-age=31536000; includeSubDomains' | sudo tee -a /etc/default/caddy
The value of the HSTS variable will be set as the value of the Strict-Transport-Security response header.
Rate Limiting
Rate limiting may be applied to the reverse proxy to protect against potential DoS types of attacks. By default, Bowtie Controllers ship with a modest rate limit in place to safeguard the application API endpoints.
To configure this setting, define the RATELIMIT variable in /etc/default/caddy. The indicated limit is evaluated over a 20-second interval and bucketed by remote address. For example, to restrict the total number of requests originating from a single IP to only 200 total over any given 20-second period of time, issue the following command either as root or as shown here with sudo:
echo 'RATELIMIT=200' | sudo tee -a /etc/default/caddy
Appliance Utilities
By default, each Bowtie Controller appliance ships with a small collection of tools to aid in their operation, such as observability tools.
Backup Tools
The recommended approach to achieve high availability for Bowtie Controllers is to leverage Multi-Controller Setup. Deploying multiple Controllers ensures resiliency against the loss of Controllers in a cluster, but to persist stateful data outside the context of a deployment of a cluster of Bowtie Controllers, you may leverage Backup and Restore.
Backup Encryption
Controller backups are encrypted. Before using the backup or restore capabilities for a Controller, you must define a valid encryption/decryption key (or password) for either the backup process or restoration process to use. Consult the Backup Encryption section for additional information.
Enable backups by first configuring Backup Encryption then defining the desired backup endpoint, schedule, and retention scheme under the desired Controller’s backup strategy. You may pass in repository credentials for endpoints like S3 or Minio using Backup Settings. Once configured, you can optionally control backups via the Backups page.
Grafana
Navigate to https://example.com/grafana (using your controller’s hostname instead of example.com) in order to access Grafana dashboards.
Note that access to Grafana is gated by authentication against the Controller’s web Control Plane Interface page to limit exposure of the application, so please login to the Control Plane Interface before proceeding to the /grafana endpoint.
Custom Dashboards
Your Controller ships with a number of dashboards available by default. Although these dashboards cannot be edited (they are provisioned), you may freely define your own dashboards that we be retained across Updating Controllers that may otherwise update or change pre-built dashboard resources.
Grafana does not start with default credentials set and instead relies solely upon your SSO configuration to authenticate and authorize users. If you haven’t configured SSO already, you will need to do so in order to login to and use Grafana.
Some dashboards come pre-configured for your immediate use. The appliance collects system-level metrics as well as logs through the system journal. Browse to the “Node Exporter” dashboard shown below in order to see a system-level dashboard summarizing metrics such as CPU use, memory, and network activity:
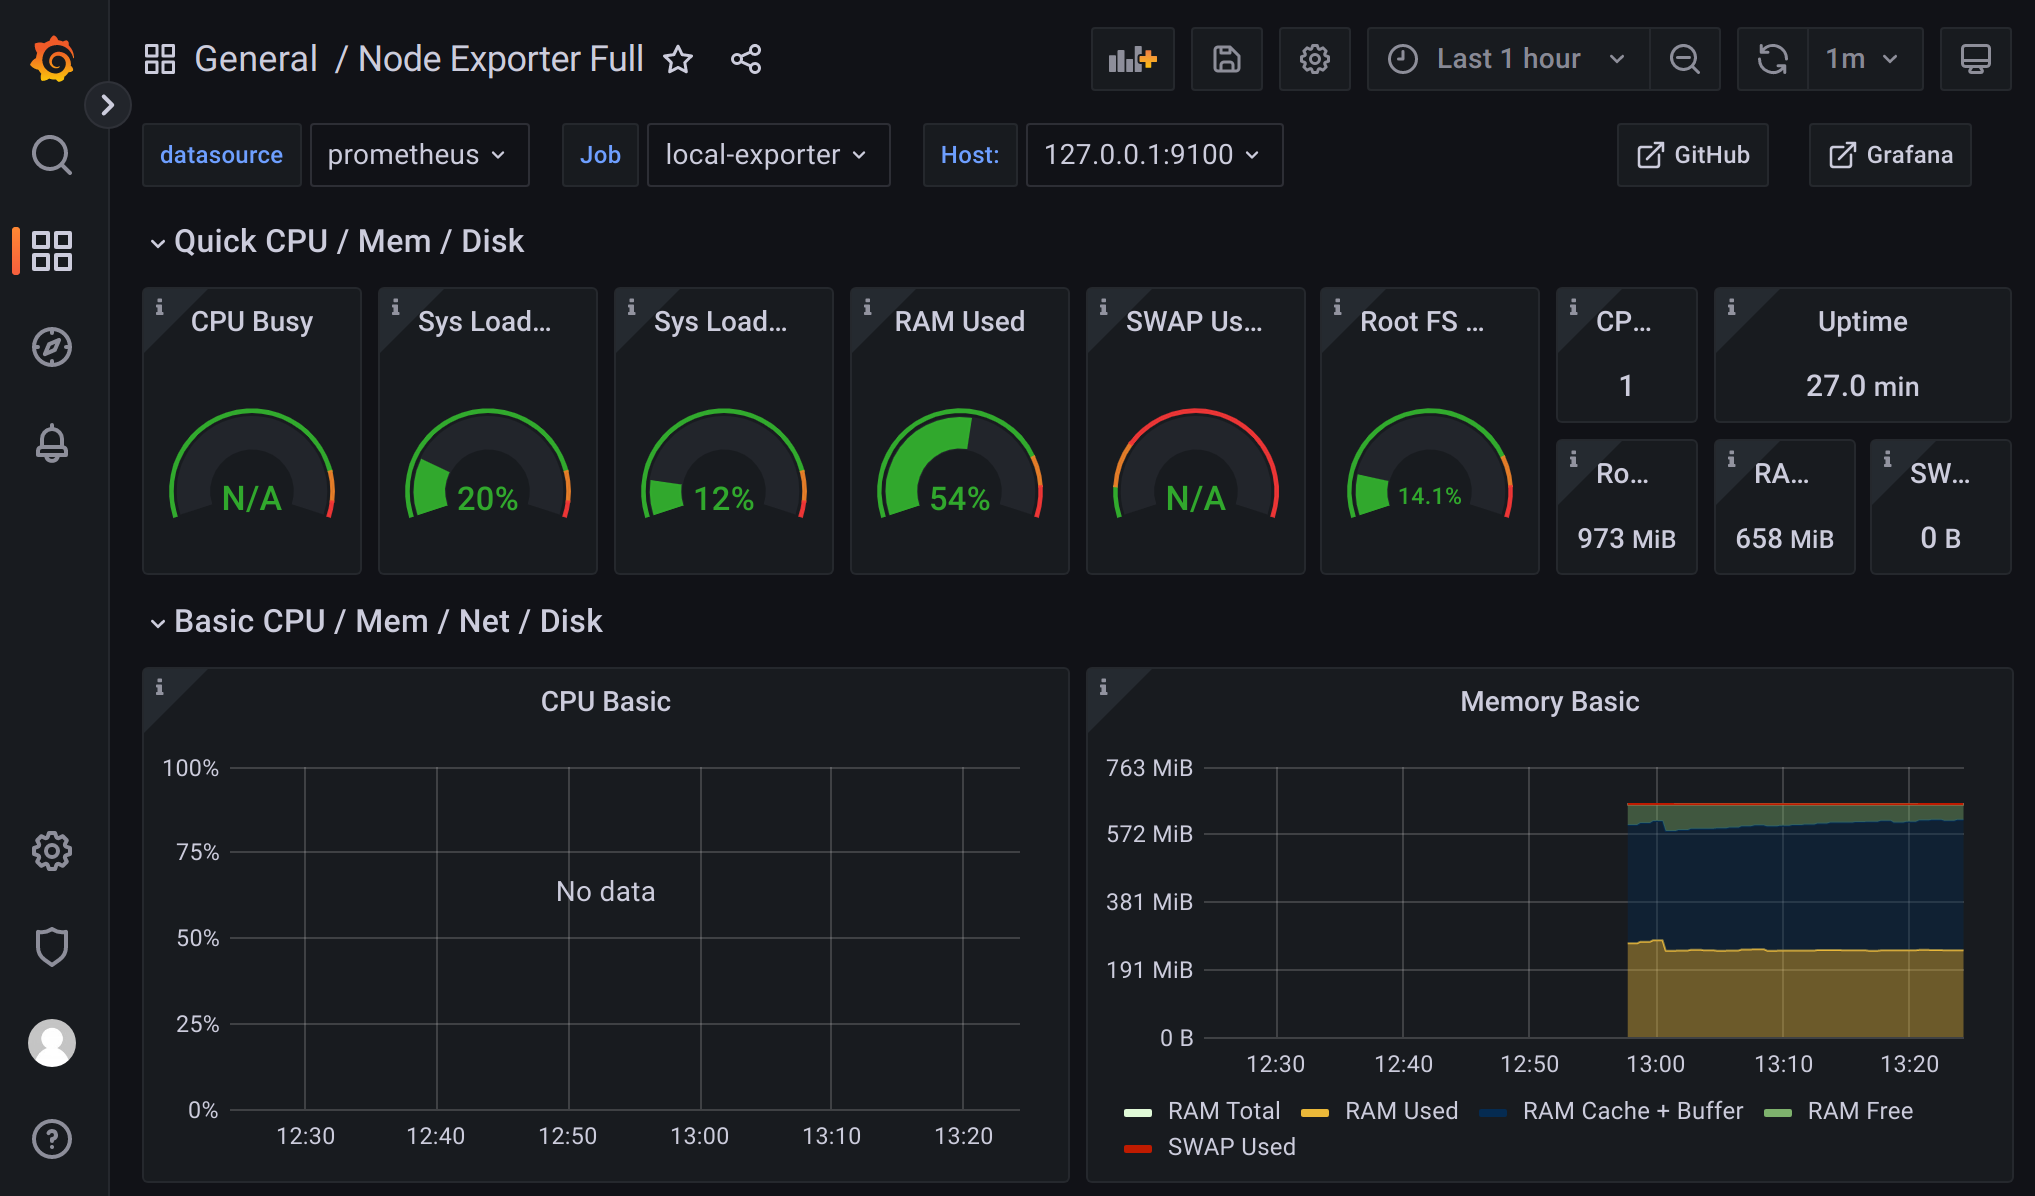
Similarly, the “Explore” page on the sidebar provides access to the host’s logs (drawn from journald).
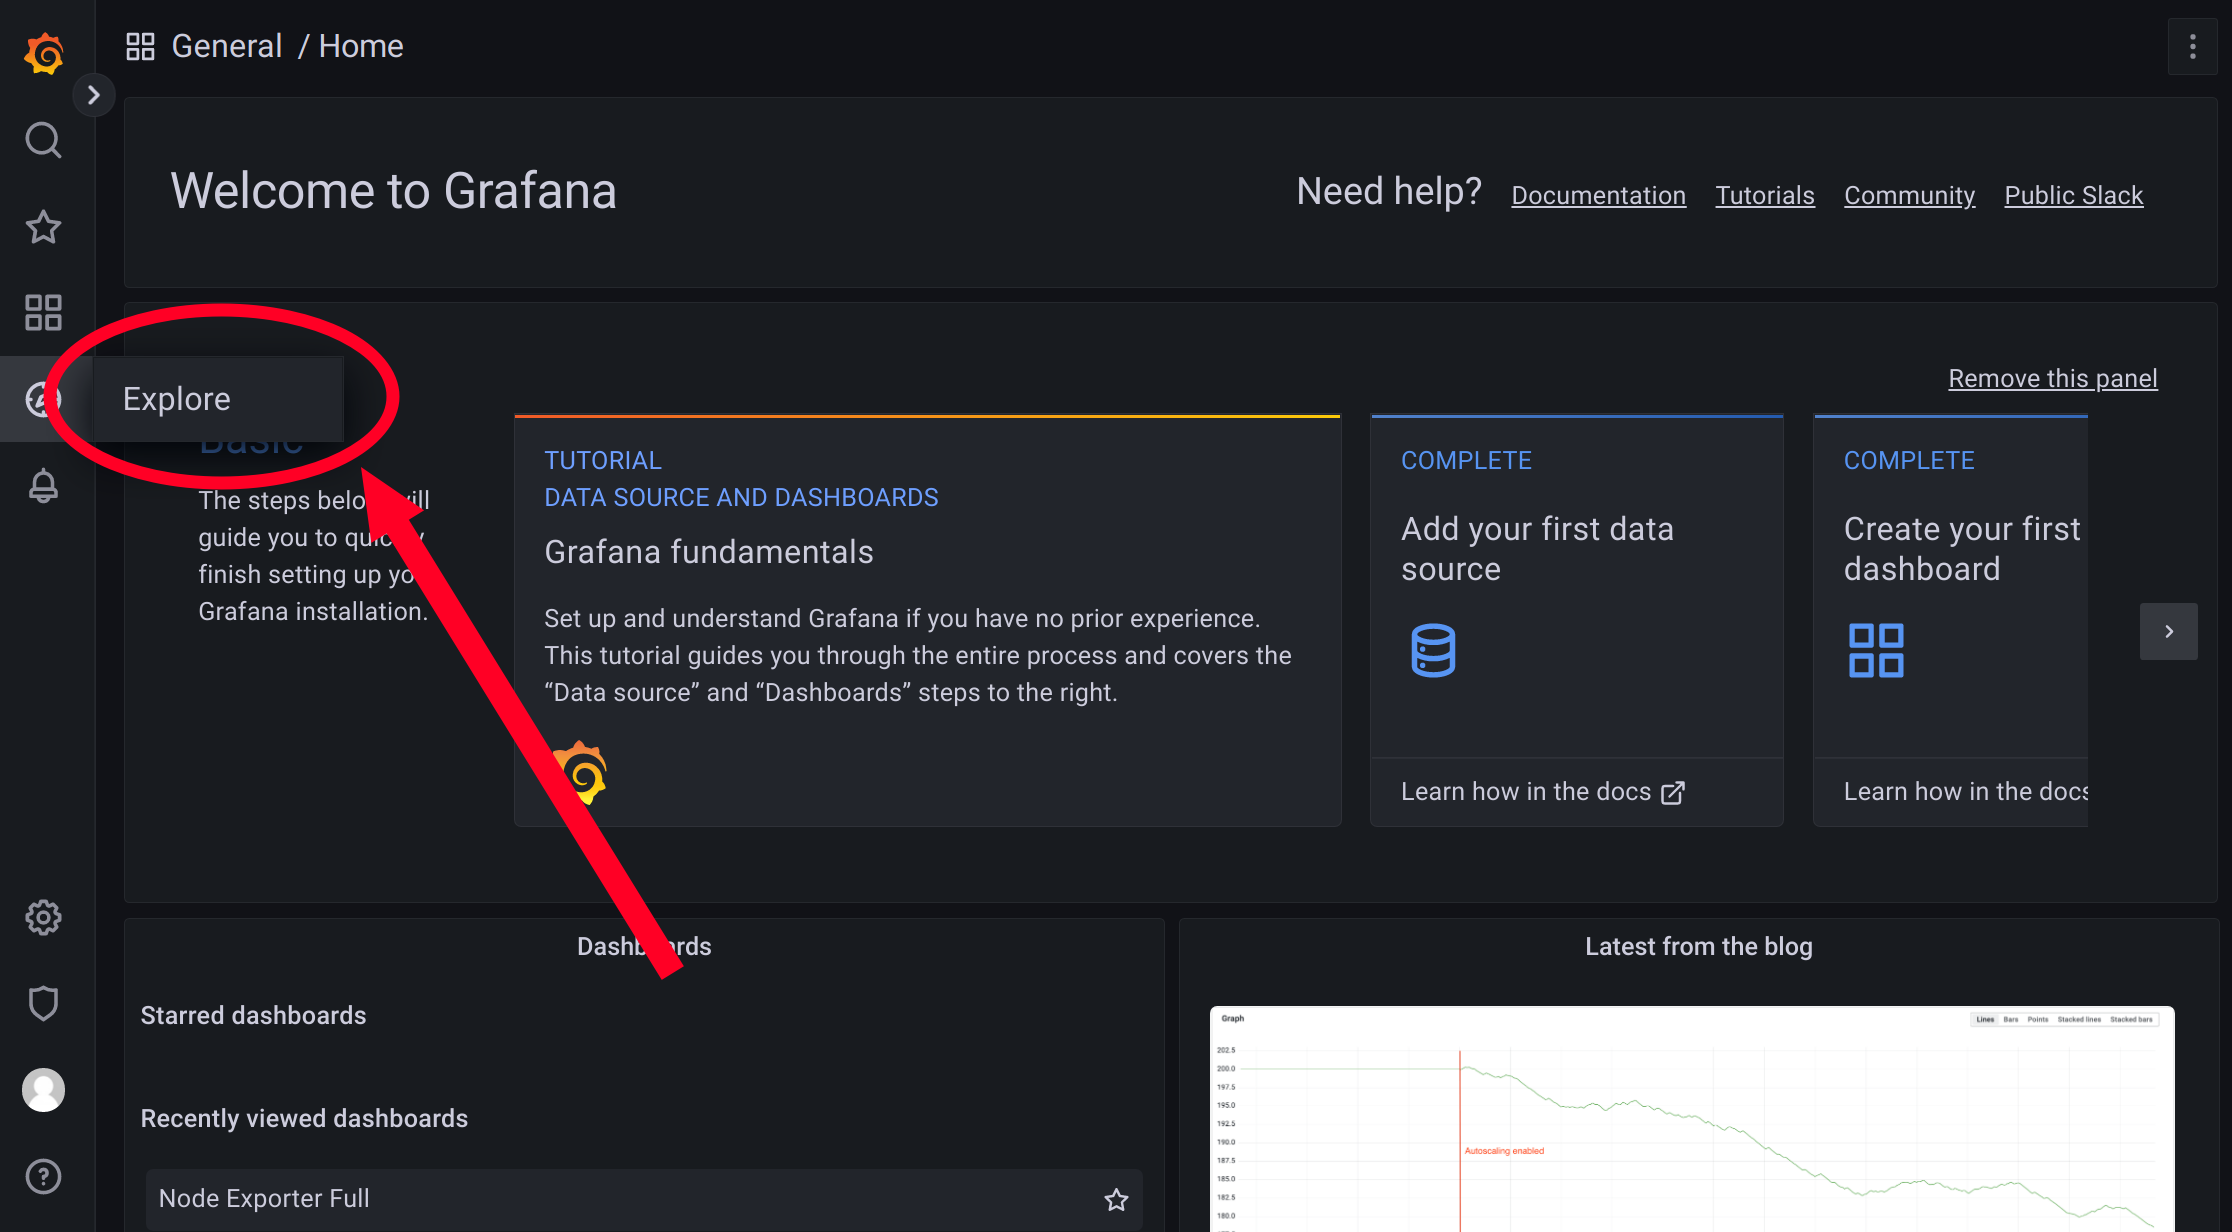
The “Explore” dashboard is a normal Grafana log exploration interface. Use the following guide to aid in navigating system logs:
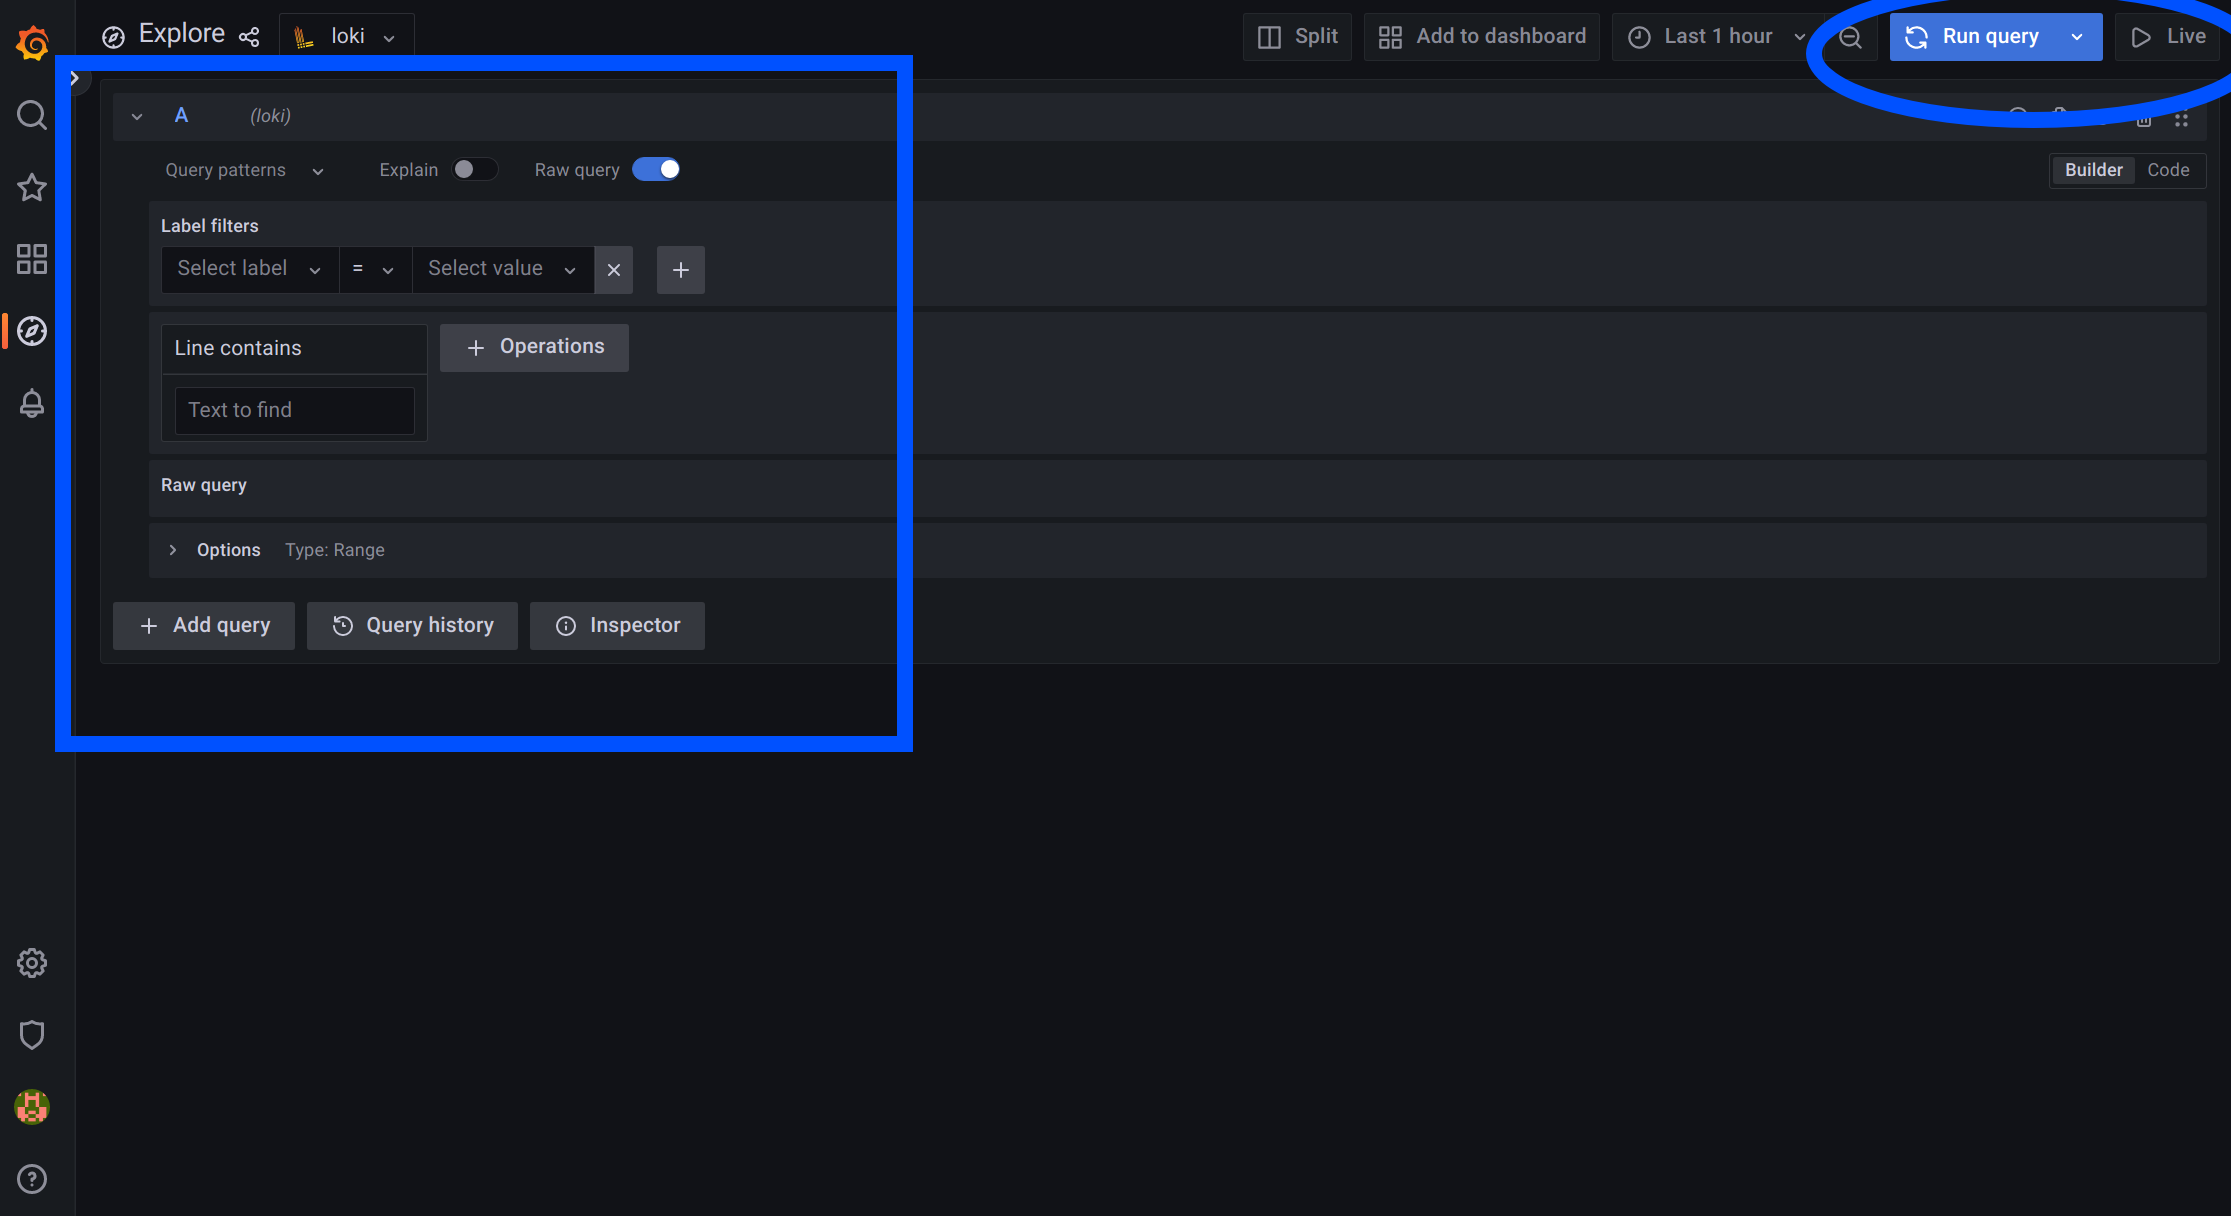
In the screenshot above, the blue box highlights filtering and searching capabilities, while the blue circle indicates where to either run the entered queries or stream the results continuously.
Label filterslets you trim down which logs you’d like to view.Click
Select labeland choosejob, then clickSelect valueand choosesystemd-journalin order to see all journal logs. Click either the blue reload icon or theLivebutton at the top right of the screen to stream logs.Click
Select labelthenunitand then clickSelect value,bowtie-server.servicein order to see logs emitted from thebowtie-server.service.
The box underneath
Label filtersdefaults to aLine containsquery. In the text box, enter any text in order to search all filtered logs for an arbitrary string.For example, click on the
XunderLabel filtersif you have any existing label filter and create a new query for all logs by choosingjoband thensystemd-journal. Then enter a string likewgto query for all wireguard-related activity in the system logs.
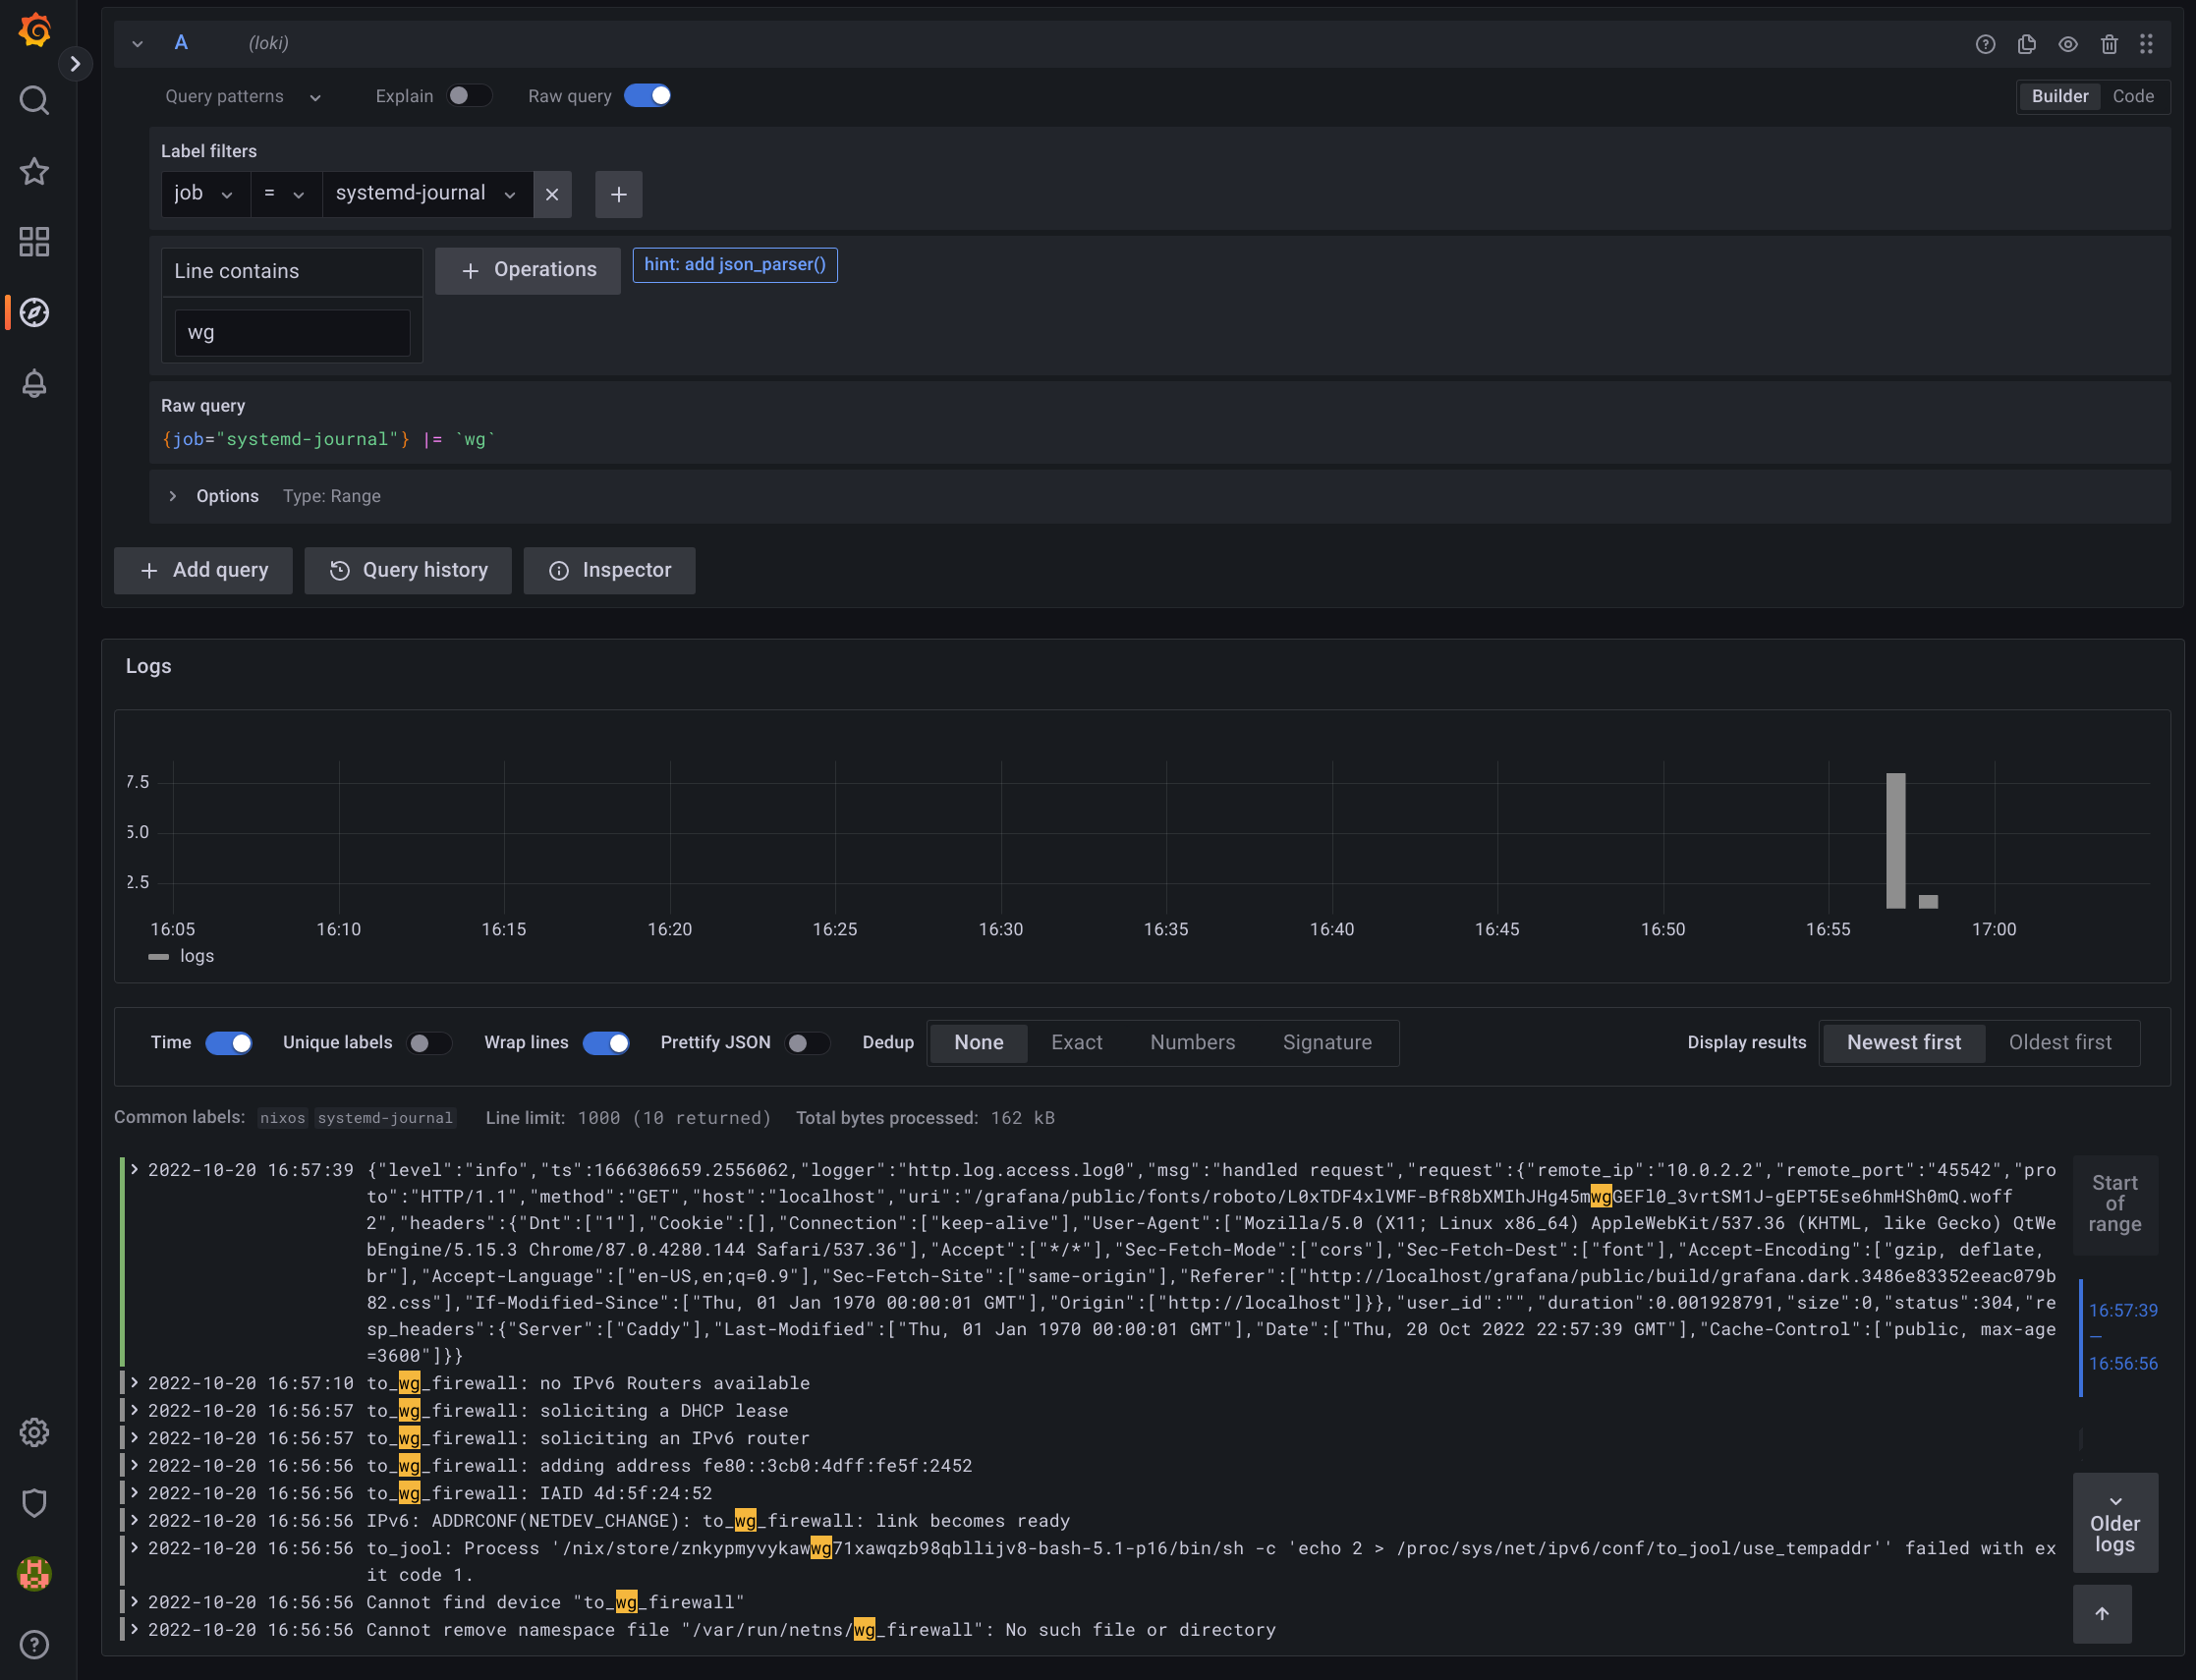
Kubernetes Maintenance
Helm Maintenance
Kubernetes support via Helm charts is still experimental and under development. See Kubernetes Installation for more.
Bowtie Helm chart deployments behave like most other workloads: you can perform a
helm upgrade
When new Bowtie releases occur, updated Helm charts are provided that may also bump the appVersion to point at updated Bowtie container tag versions.
This may trigger updated Deployment changes that will roll Pod updates.
As long as the PersistentVolumeClaim that persists Bowtie remains available, the Bowtie containers will perform any necessary migrations that may ship with updated container versions.